Figure 4.
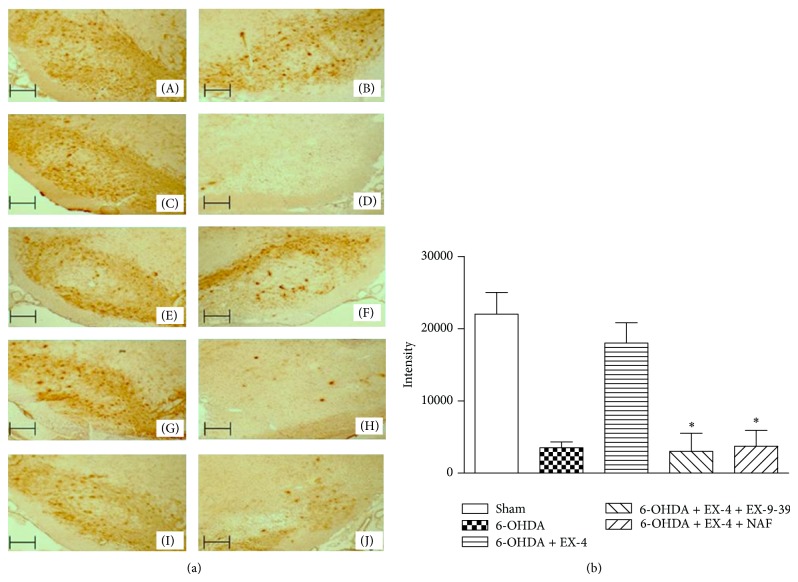
(a) Representative photomicrographs of 12 μm cryostat sections through the rat SN immunoassayed for TH. Nigral TH cell bodies appear dark brown in colour visualised using DAB staining; (A) and (B) represent right and left untreated SN, respectively; (D) represents 6-OHDA lesion assessed after two weeks compared to untreated side (C); (F) shows the effect of 0.5 μg/kg exendin-4 in a 6-OHDA-treated animal one week after lesion compared to untreated SN (E); (H) and (J) represent the effect of EX-9-39 or NAF coadministration, respectively, in 6-OHDA- and EX-4-treated animals compared to corresponding untreated sides (G) and (I). Scale bars—100 μm. (b) represents quantified data from immunohistochemical analysis of SN for TH. DAB staining was quantified using Lucia G image analysis software based on colour intensity. Results analyzed using one-way ANOVA and a post hoc Bonferroni test to compare differences between groups. ∗indicates significant differences compared to 6-OHDA + EX-4 group (ANOVA F[4, 25] = 16.99, ∗P < 0.05, n = 6 per group, confidence interval set at 95%).

