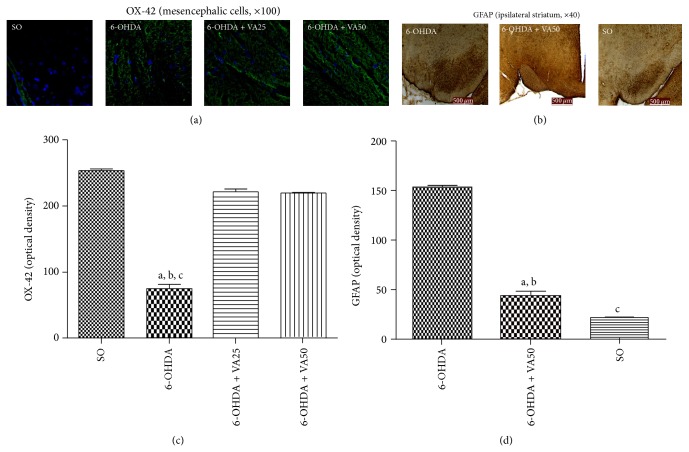
Figure 6.
Representative photomicrographs ((a), (c)) and measurements of corresponding relative optical densities in 3–5 fields ((b), (d)), showing that valproic acid (VA) treatments reverse the increases of OX-42, visualized as a green fluorescence with cells nuclei presenting a blue fluorescence, and of GFAP immunoreactivities (brown staining), in the rat mesencephalon (right lesioned side) of the untreated 6-OHDA group. Scale bars represent 500 μm (magnifications: ×100 for OX-42 and ×40 for GFAP). The relative optical densities were measured by Image J software. OX-42: a. versus SO, q = 47.94; b. versus 6-OHDA + VA25, q = 41.46; c. versus 6-OHDA + VA50, q = 40.90. GFAP: a. versus SO, q = 27.40; b. versus 6-OHDA + VA50, q = 23.11; c. versus SO, q = 4.29 (one-way ANOVA and Newman-Keuls as the post hoc test).

