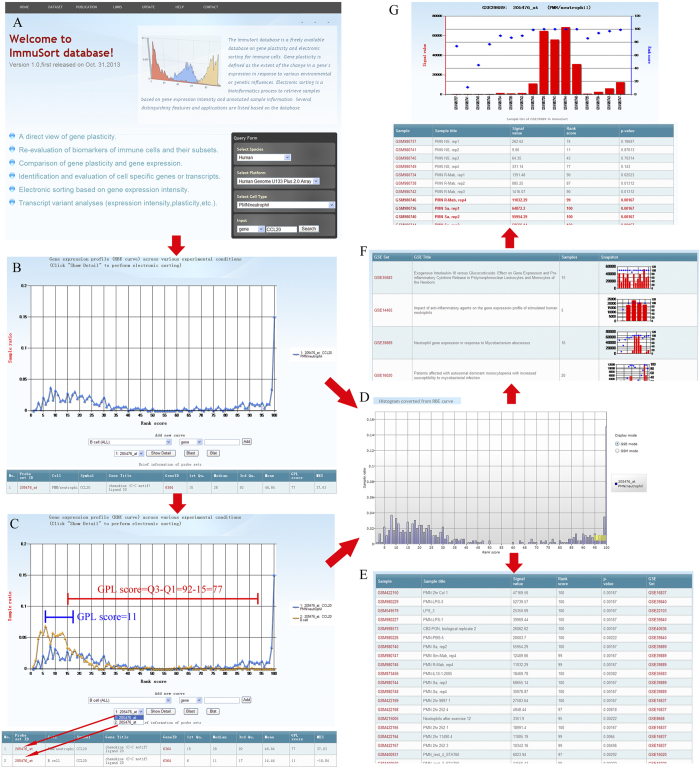
Figure 1.
An example illustrating ImmuSort database browsing. (A) Search with the gene symbol ‘CCL20’ in human PMNs/neutrophils. (B) The query output. The RBE curve indicates the CCL20 GEP and its sample distribution across various experimental conditions. The x-axis represents the percentile rank score that reflects the gene expression intensity. The y-axis represents the sample ratio at an indicated rank score. The button ‘Show Detail’ links to further electronic sorting analysis. The lower table-format panel shows brief information about the queried probe sets. (C) A novel RBE curve for CCL20 in B cells is added. The added probe set information is shown in the lower table-format panel in an ordered fashion (see red arrows). (D) The GEP is shown in an interactive fashion after finishing the probe set selection and clicking on the ‘Show Detail’ button. Two modes are available to allow users to retrieve or conduct electronic sorting of the cell states (or experiment conditions) that are associated with a bin by clicking it. A bin range is selected by clicking and holding the mouse cursor on a column in the left side and releasing it over another column. In the GSM mode (E), all of the cells (GEO samples/GSMs) that are associated with rank scores from 95 to 100 for CCL20 and a brief description of the sample are listed. In the GSE mode (F), a list of all of the GSEs containing the cells/GSMs within the selected bin that range from 95 to 100 are shown. The right cell snapshots provide further links to the sample information associated with the GSEs, such as GSE39889 (G). In E and G, the signal values, rank score and p values to evaluate the difference between the PM and MM probe values are shown. The items in red (G) indicate the samples that are associated with the clicked bin or selected bin range. An online help page on the ImmuSort website also provides operational details.

