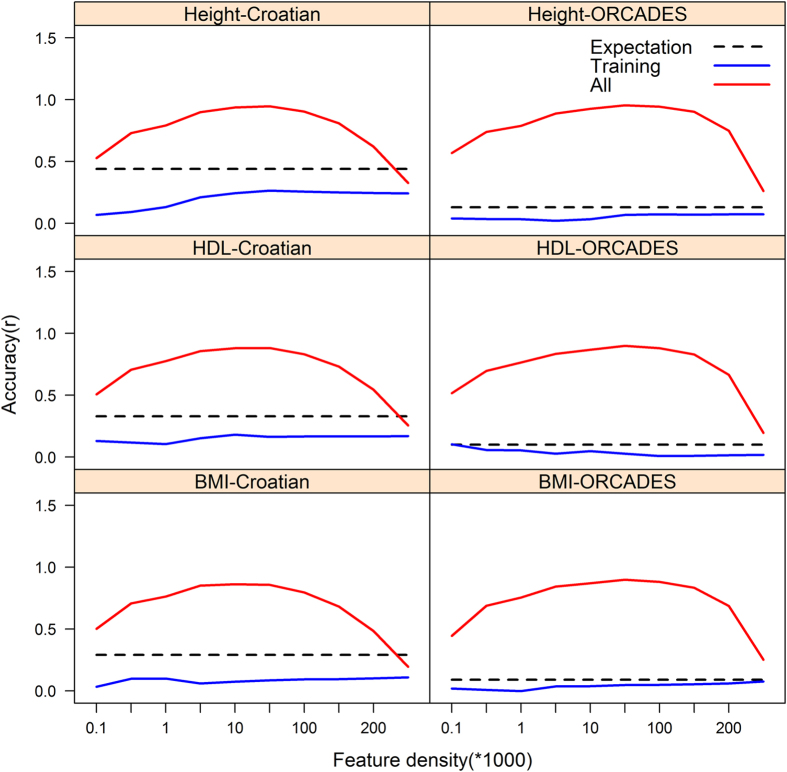
Figure 1.
The mean prediction accuracy (correlation between predicted and observed phenotype) across the test data sets, following tenfold cross validation the Croatian data and into ORCADES replication data; when feature subsets were ranked, and subsequently selected based on GWAS p-values estimated in each of training folds (“Training”), and when feature subsets were ranked, and subsequently selected based on GWAS p-values estimated from the whole Croatian data set (“All”). The broken black lines depict the theoretical expectation (Expectation) in related and unrelated individuals13. The sold blue lines depicts the mean accuracy results across the folds when ranking and selection of feature subsets was based on GWAS P-values estimated from the training data only. The sold red lines depicts the mean accuracy results across the folds when ranking and selection of feature subsets was based on GWAS P-values estimated from all the Croatian data. There was substantial inflation of the prediction accuracy for all three traits in this study, when training data was used in feature selection i.e. when subsets were ranked and subsequently selected based on GWAS p-values estimated from the whole Croatian data set.

