Figure 3.

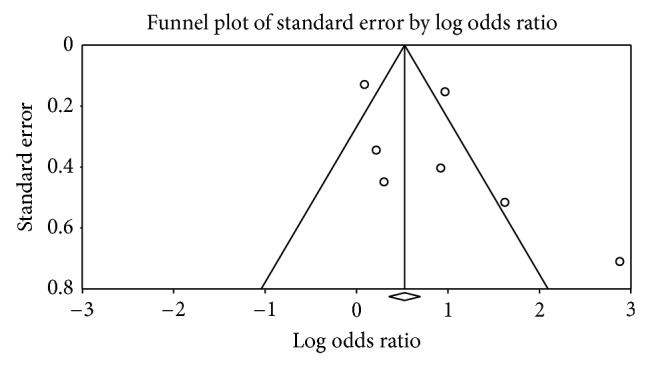
Funnel plot (publication bias assessment plot) of the odds ratio of lung cancer, by the standard error, for all studies. Circles: studies in the meta-analysis. Odds ratios are displayed on logarithmic scale.

Funnel plot (publication bias assessment plot) of the odds ratio of lung cancer, by the standard error, for all studies. Circles: studies in the meta-analysis. Odds ratios are displayed on logarithmic scale.