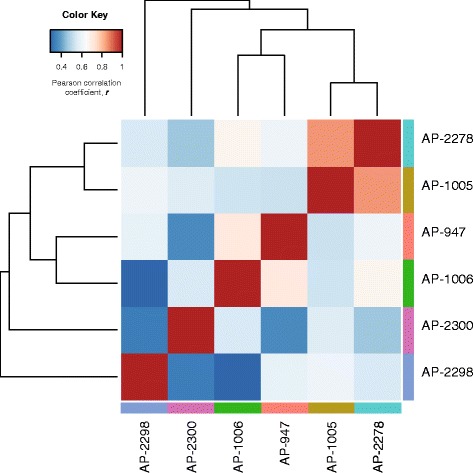
Figure 4.

Variation in the drought metabolome among six genotypes of P. balsamifera represented by a Pearson correlation coefficient (PCC) heatmap. Differential abundance [log2 (fold-change)] for metabolites significant for treatment main effect (ANOVA, p < 0.05) are represented. The PCC value was calculated for each pair-wise comparison among genotypes, and is represented by the colour in the given cell. All genotypes are represented on both the x- and y-axis in the same order.
