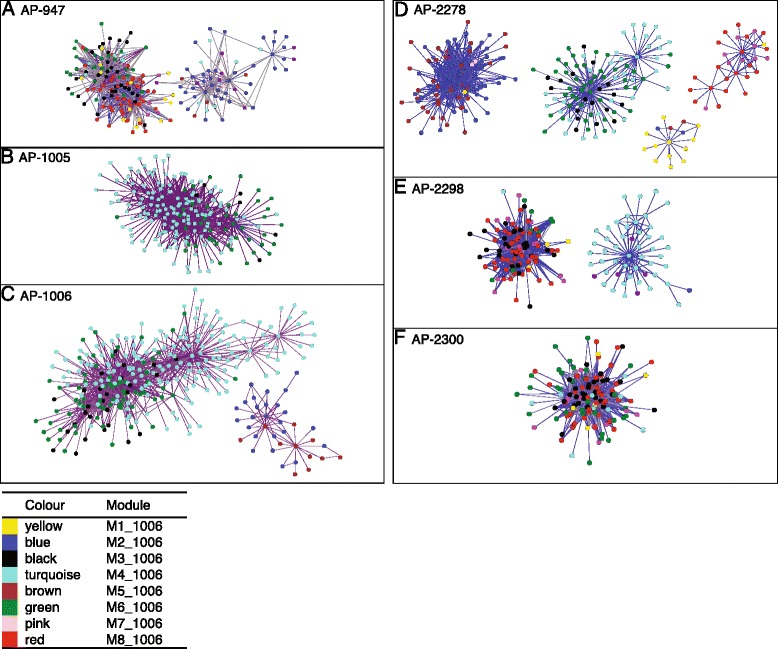
Figure 6.

Transcript correlation networks obtained from WGCNA for (A) AP-947, (B) AP-1005, (C) AP-1006, (D) AP-2278, (E) AP-2298 and (F) AP-2300. The top 1000 interactions for each genotype are represented. Nodes in the graphs represent individual transcripts that connect via edges to other transcripts. Each node is colored according to the modules defined in Table 4.
