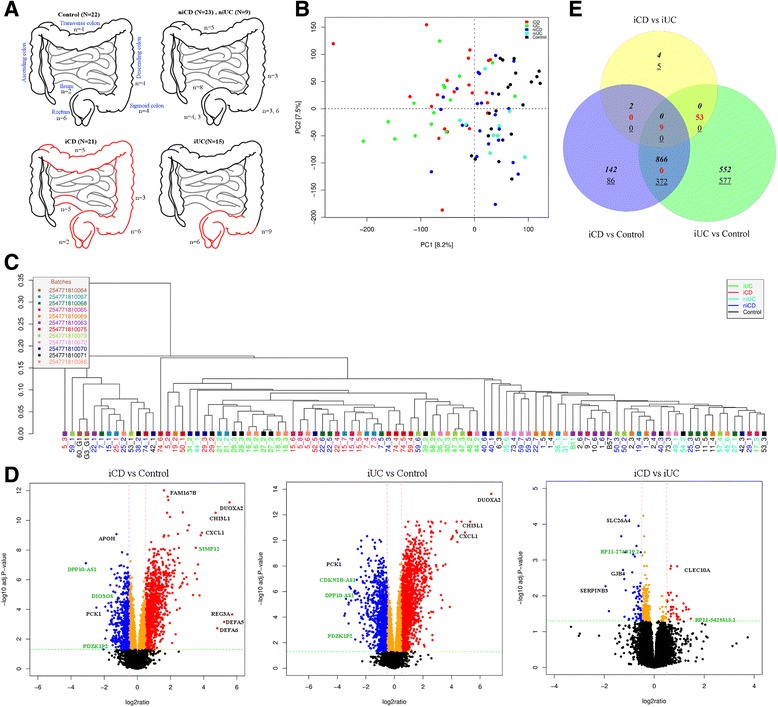
Figure 1.

Study design and inflammatory gene signature for iCD and iUC. (A) Study design included 90 pinch biopsies from multiple colonic regions for both inflamed and non-inflamed mucosa (21 iCD, 23 niCD, 15 iUC, 9 niUC and 22 healthy controls samples). (B) Principal component analysis (PCA) separated inflamed CD (iCD) and inflamed UC (iUC) samples from non-inflamed and healthy controls. PC1 and PC2 together explained 15% of the total variation. (C) Unsupervised hierarchical clustering of the most dynamic probes (coefficient of variance >0.05) across the samples resulted in clustering of samples according to their clinical subgroups. (D) The log2 ratio and -log10 adjusted P-values are plotted in the form of volcano plots for iCD versus control, iUC versus control and iCD versus iUC comparisons. The probes in red, blue and orange colors represents up-regulated (FC >1.5 and adjusted P-value <0.05), down-regulated (FC < -1.5 and adjusted P-value <0.05) and significant with small fold change (FC > -1.5 and <1.5), respectively. The non-significant probes are represented in black. The selected protein-coding genes and lncRNAs labeled in black and green, respectively. (E) Venn diagram showing the overlap between differentially expressed genes identified in iCD versus control, iUC versus control and iCD versus iUC comparisons. The up-regulated genes are depicted in italics, down-regulated as underlined and contra-regulated in red.
