
Figure 2.
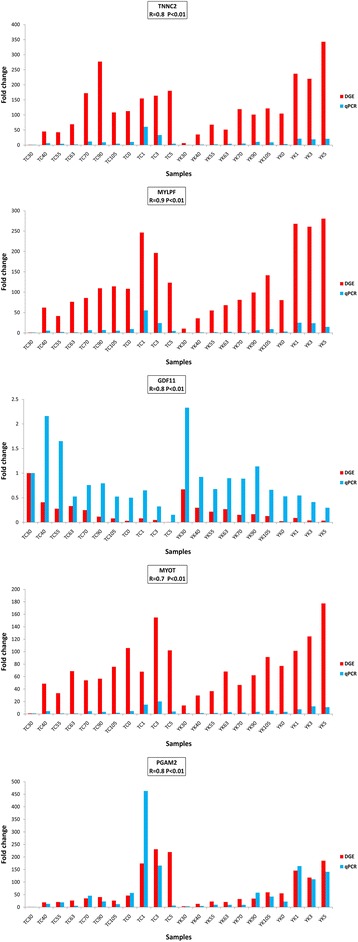
Validation of Solexa sequencing data with qPCR. The vertical axis indicates the fold change of transcript abundance. The horizontal axis indicates the samples for TC and YK pigs. The r-value shows the Spearman’s correlation between the two methods.