
Figure 6.
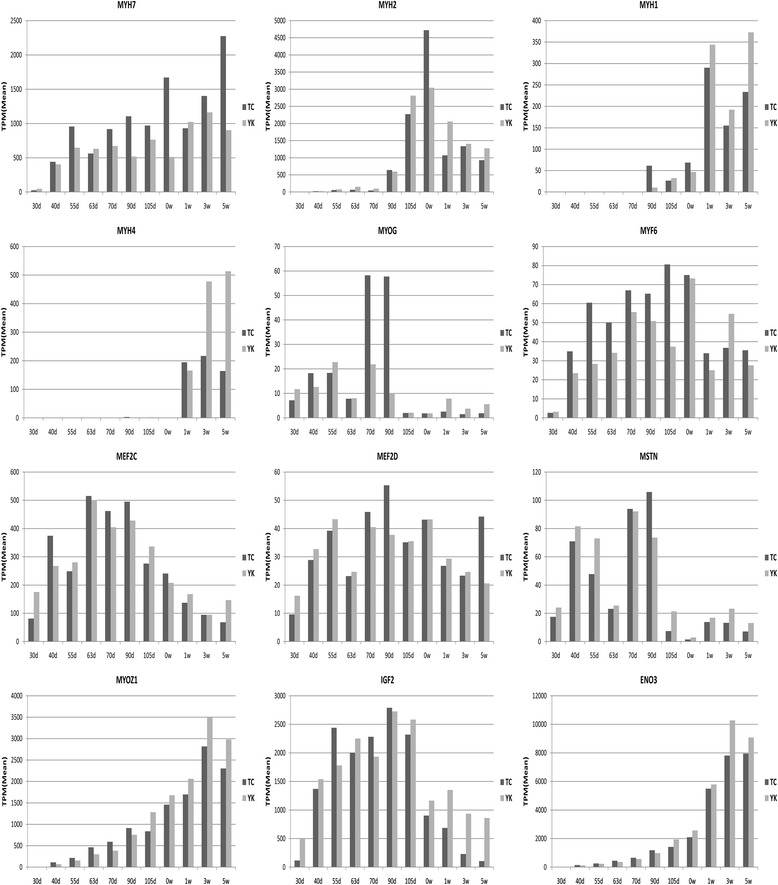
Gene expression patterns related to muscle fiber development. The vertical axis indicates the normalized gene expression level in each stage on average. The horizontal axis indicates the different developmental periods in TC and YK pigs; d indicates days prenatal and w indicates weeks of age.