
Figure 1.
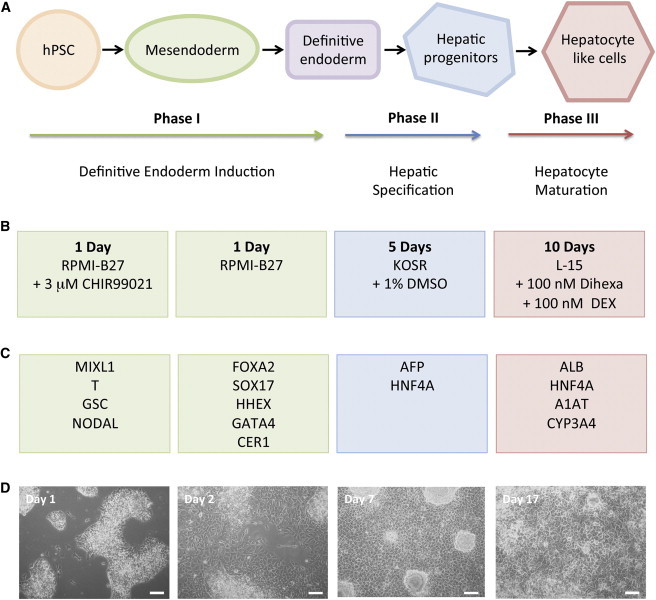
Schematic of the Differentiation Process
(A) The normal process of differentiation and the phases of the protocol to which these apply.
(B) Summary of the base media, time course, and small-molecule additions for each phase of differentiation.
(C) Key markers expressed at each stage of differentiation.
(D) Representative morphology of H1 cells observed at key stages of differentiation using phase contrast microscopy (10×). Scale bars, 100 μm.
See also Figure S1.