
Figure 4.
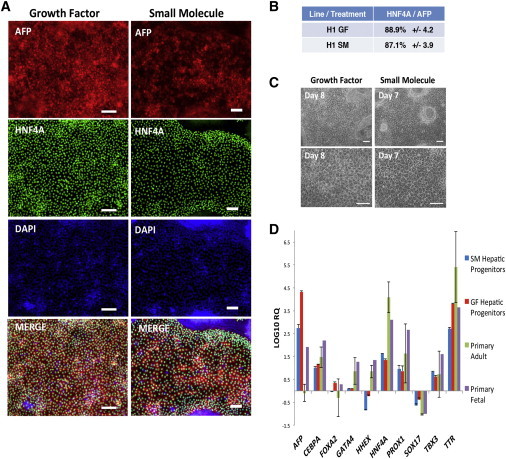
Characterization of Phase II Differentiation: Hepatic Specification
(A) Expression of AFP and HNF4A at phase II endpoint of growth-factor- and small-molecule-treated cells, imaged using fluorescent microscopy. Treatment is indicated at the head of each column. Scale bars, 100 μm.
(B) Efficiency of phase II differentiation, determined by counting AFP and HNF4A double-positive cells. Efficiencies are presented as the percentage of positive cells plus or minus the SD of all fields counted.
(C) Morphology at phase II endpoint, photographed using phase contrast microscopy at 10× and 20×. Scale bars, 100 μm.
(D) Expression of AFP CEBPA, FOXA2, GATA4, HHEX, HNF4A, PROX1, SOX17, TBX3, and TTR at phase II endpoint following either growth-factor (red) or small-molecule (blue) treatments, as measured by TaqMan. Normalized to ACTB and growth-factor- or small-molecule-derived definitive endoderm, respectively. Data are presented as the mean of three independent experiments; error bars represent SD.
See also Figure S4.