
Figure 6.
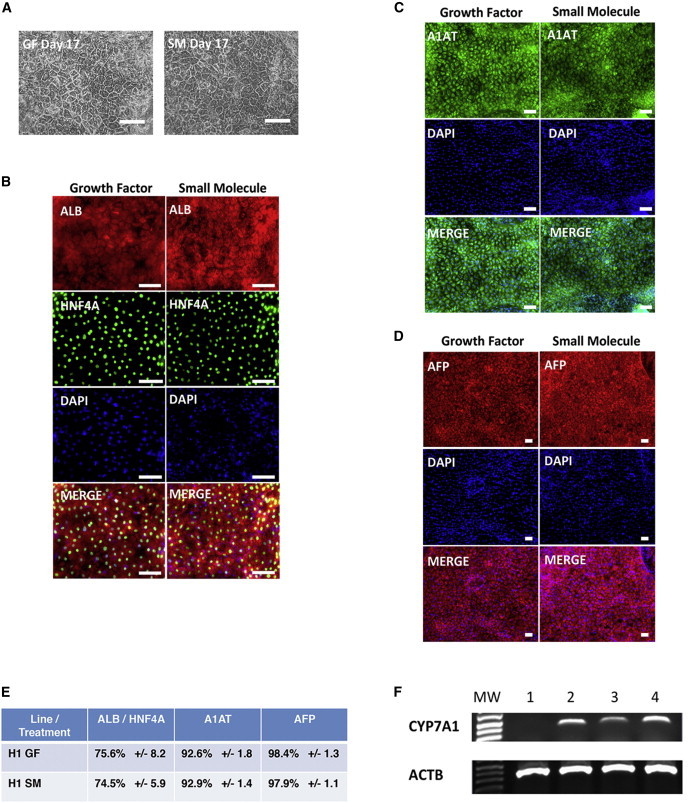
Characterization of Phase III Differentiation to Hepatocyte-like Cells: Morphology and Immunofluorescence
(A) Morphology of growth-factor and small-molecule protocol endpoints, taken using phase contrast microscopy at 10×. Scale bars, 100 μm.
(B) Expression of albumin and HNF4A at protocol endpoints, imaged using fluorescent microscopy. Treatment is indicated at the head of each column. Scale bars, 100 μm.
(C) Expression of A1AT at protocol endpoints, imaged using fluorescent microscopy. Treatment is indicated at the head of each column. Scale bars, 100 μm.
(D) Expression of AFP at protocol endpoint was imaged using fluorescent microscopy. Treatment is indicated at the head of each column. Scale bars, 100 μm.
(E) Efficiency of phase III differentiation, determined by counting albumin and HNF4A double-positive cells, A1AT-positive cells, and AFP-positive cells. Efficiencies are presented as the percentage of positive cells plus or minus the SD of all fields counted.
(F) RT-PCR of CYP7A1 gene expression of H1-derived smHLCs. Lane 1, hESC H1 control; lanes 2–4 (top panel), H1 day 17 HLCs CYP7A1 expression; lanes 2–4 (lower panel), ACTB loading control.
See also Figure S6.