
Figure 4.
DENND2C Phenotype Is Induced by Loss of Active RHOA and RAC1
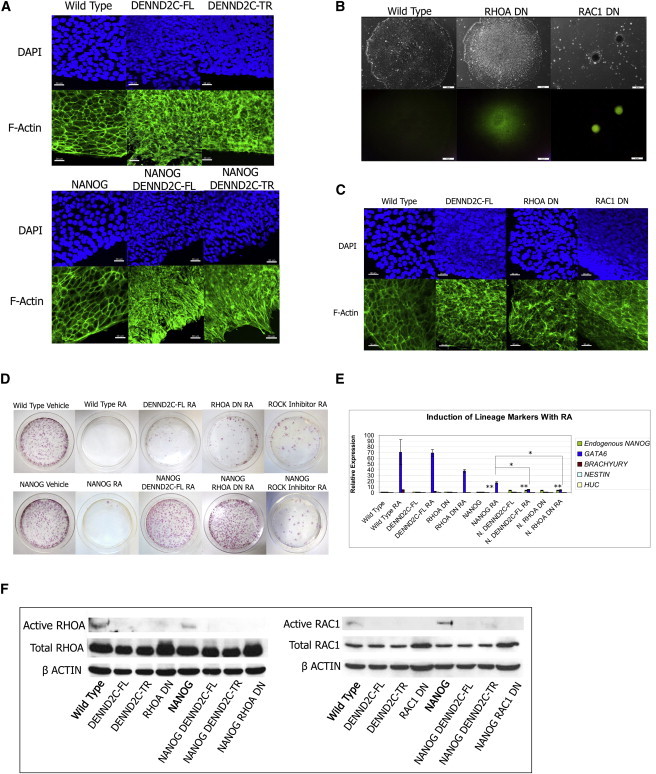
(A) DAPI and F-actin immunostaining of WT and DENND2C expressing human ES cells. Scale bar represents 30 μm.
(B) Brightfield and OCT4-EGFP reporter images of cells stably expressing dominant-negative RHOA T19N (RHOA DN) and dominant-negative RAC1 T17N (RAC1 DN). Scale bar represents 50 μm.
(C) DAPI and F-actin immunostaining of WT and RHOA DN and RAC1 DN mutant human ES cells. Scale bar represents 30 μm.
(D) Plates stained for alkaline phosphatase after RA/G418 treatment. Experiments were performed in triplicate. A representative plate for each set of experiments is shown.
(E) The induction of lineage markers with RA assessed by real-time PCR. RA treatment induces differentiation as reflected by the induction of the endoderm marker GATA6. NANOG expression from PB induces some repression of GATA6 and no upregulation of endogenous NANOG. NANOG/DENND2C and NANOG/RHOA DN cells display enhanced repression of GATA6 and upregulation of endogenous NANOG at the RNA level. Graph shows mean of triplicate independent experiments. Error bars represent SD. ∗∗p < 0.001, ∗p < 0.05 in Student’s t test.
(F) Immunoprecipitation of active RHOA and RAC1 in DENND2C expressing cells. DENND2C expressing cells have decreased active RHOA and RAC1 relative to WT cells.
See Figure S2 for additional information.