
Figure 5.
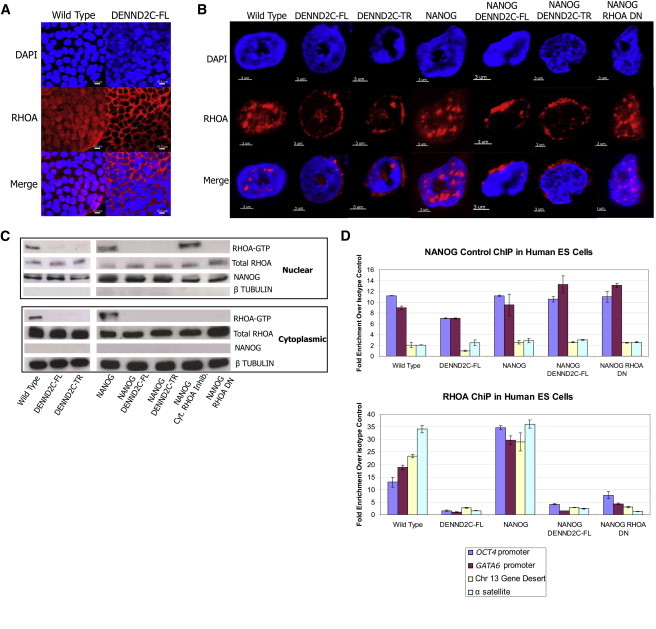
DENND2C Negatively Regulates Nuclear RHOA Activities
(A) DAPI and RHOA immunostaining of WT and DENND2C expressing ES cell colonies. Scale bar represents 10 μm.
(B) DAPI and RHOA immunostaining of isolated WT and DENND2C expressing nuclei. Scale bar represents 3 μm.
(C) Immunoprecipitation of active RHOA from nuclear and cytoplasmic fractions of WT and mutant cells. DENND2C and RHOA DN cells have reduced active RHOA in both nuclear and cytoplasmic fractions. Cytoplasmic RHOA inhibitor (RAB35) is included as a negative control.
(D) ChIPs performed in human ES cells with a RHOA monoclonal antibody and NANOG-positive control antibody. Presented is the average fold enrichment over IgG control of the OCT4 promoter, GATA6 promoter, chromosome 13 gene desert, and α satellite DNA. Error bars represent the mean percent fold enrichment over IgG control ± the SEM for triplicate technical replicates.
See Figure S3 for additional information.