
Figure 5.
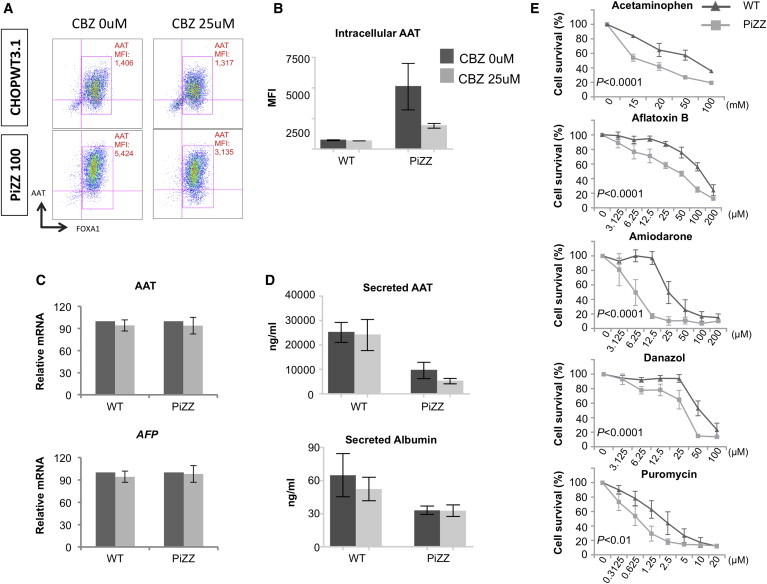
PiZZ and WT iPSC-Hepatic Cells Diverge in Their Response to Drug Treatment
(A) Representative flow cytometric analysis of AAT MFI in WT and PiZZ iPSC-hepatic cells (T24) following a 48-hr treatment with control vehicle or CBZ.
(B) Aggregate data from three WT and three PiZZ lines, including data represented in (A), are quantified graphically. n = 3 independent experiments.
(C) AAT (SERPINA1) (top) and AFP (bottom) mRNA expression levels with and without CBZ treatment, expressed as a percentage of untreated levels.
(D) Concentration of AAT (top) and albumin (bottom) in iPSC-hepatic cell supernatants measured by ELISA. n = 3 independent experiments.
(E) Viability of PiZZ and WT iPSC-hepatic cells is quantified by MTT assay after incubation with acetaminophen (4 hr) or aflatoxin B, amiodarone, danazol, or puromycin (4 days) at the indicated concentrations. Survival percentage at each concentration is determined as a percentage of vehicle control treatment. n = 3 independent experiments. Data are represented as mean ± SEM. P values represent contribution of cell type to variance as determined by two-way ANOVA.