
Figure 6.
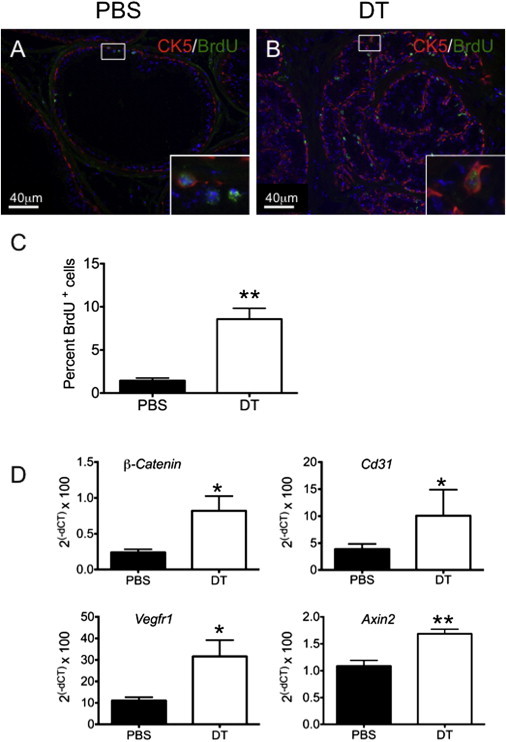
Delayed Regenerative Profiles following Depletion of Lgr5+ Cells
(A and B) Immunofluorescence of BrdU in the anterior lobes of prostate sections from Lgr5DTR.EGFP mice administered either PBS (A) or DT (B). The insets are enlarged images of the boxed areas.
(C) Quantification of BrdU+ cells as a percentage of total epithelial cells in the anterior lobes of prostates: DT, 8.6%, cn = 11,242, n = 3 mice; PBS, 1.5%, cn = 9145, n = 3 mice; p = 0.005.
(D) Transcriptional analysis of prostate tissue following Lgr5+ cell depletion; n = 4 animals per group.
All values are represented as mean and SEM. ∗p < 0.05, ∗∗p < 0.01.