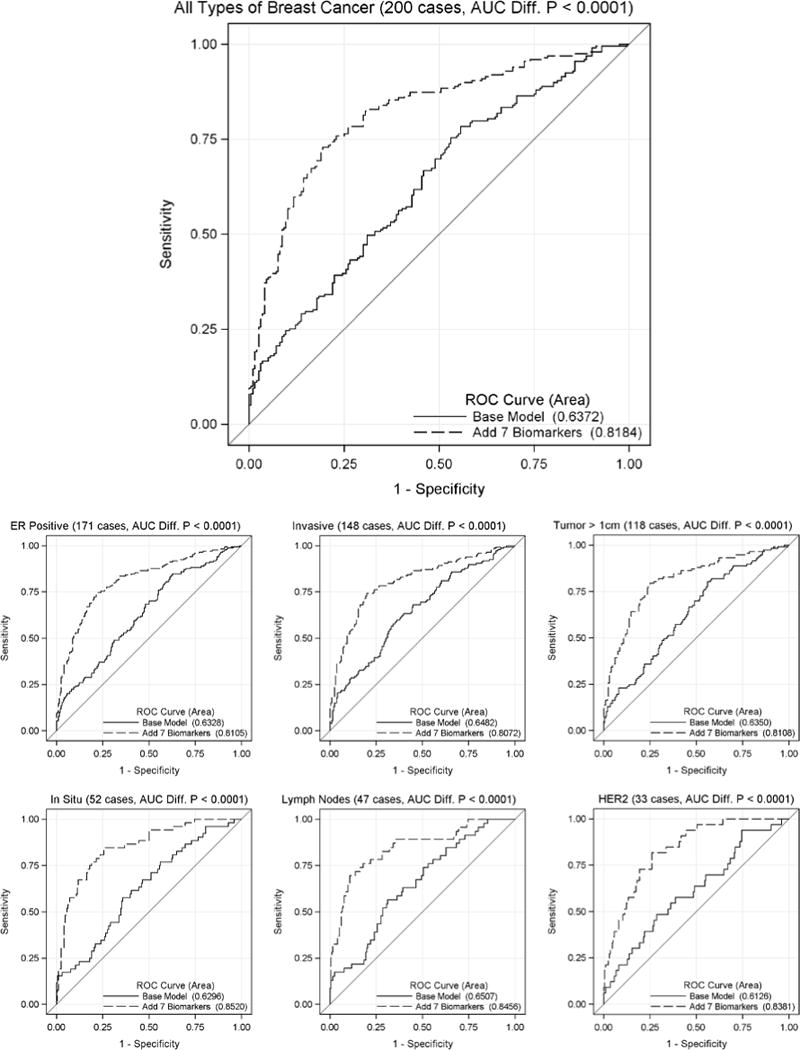
Figure 2.

ROC curve comparison for classification of breast cancer patients. The autoantibody responses against seven antigens (i.e. ANGPTL4, DKK1, GAL1, GFRA1, GRN, LRRC15 and MUC1) were added to a logistic regression model that included age, BMI, race and current smoking status. The ROC curves were determined for all subjects (top) and by specific subtypes of breast cancer including ER positive, invasive, maximum tumor dimension > 1 cm, in situ, lymph node involvement and HER-2 amplification (bottom).
