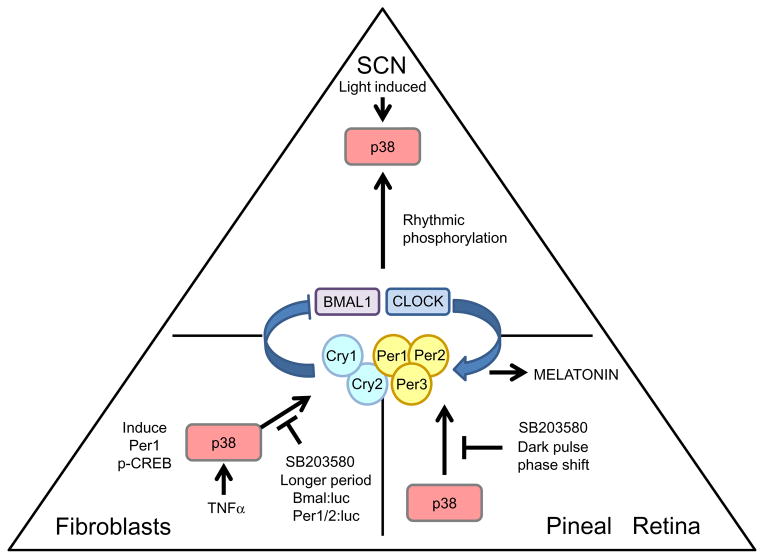
Figure 1.6.
The role of p38 MAPK in the circadian clock. The diagram presents the most representative tissues in mammals with regard to the function of p38—either SCN, fibroblasts, or the pineal/retina. The oscillator in the center of the triangle represents the cellular oscillator in the respective tissues. The arrows that are drawn toward the oscillator represent a circadian input pathway. The lines that are drawn away from either the oscillator or p38 MAPK represent output pathways. The labels indicate the functions of pathways or perturbations on the activity of p38.

