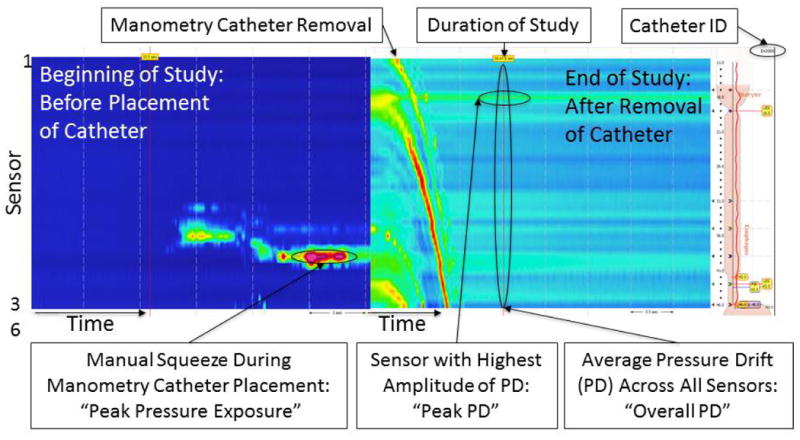
Figure 1. Measurement of pressure drift (PD) and duration of study immediately after removal of the manometry catheter.

Representative color contour plots during placement and removal of manometry catheter. Catheter removal is easily recognizable at the end of study by a distinct topographic appearance similar to a “waterfall”. “Overall PD” was defined as the average residual pressure across all 36 sensors immediately (<1 second) after removal of manometry catheter. “Peak PD” was the sensor with highest amount of PD among 36 recording sensors of a study. Manual squeeze of manometry catheter at the beginning of study is often recognized by a characteristic extreme pressure measurement of few sensors while other sensors measure ambient atmospheric pressure of zero. Unique identifier of the manometry catheter of each study is embedded in the right upper corner of the analysis window.
