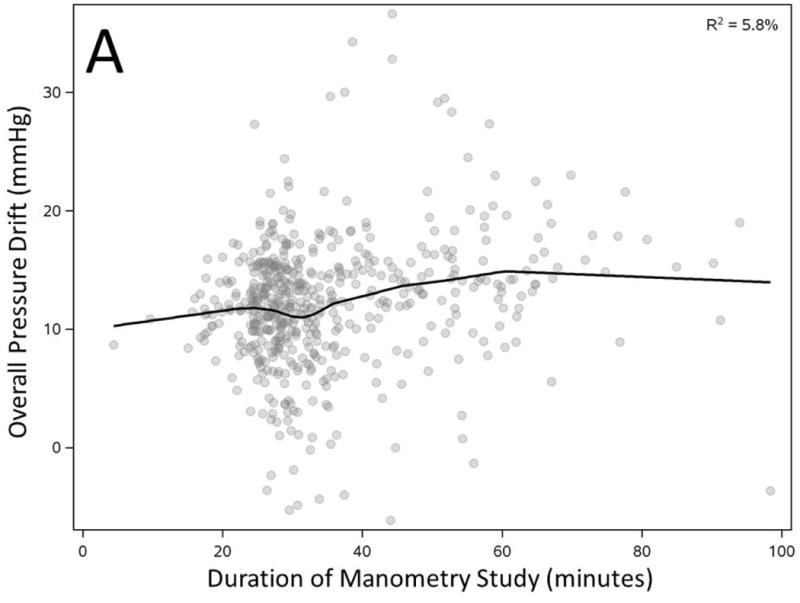
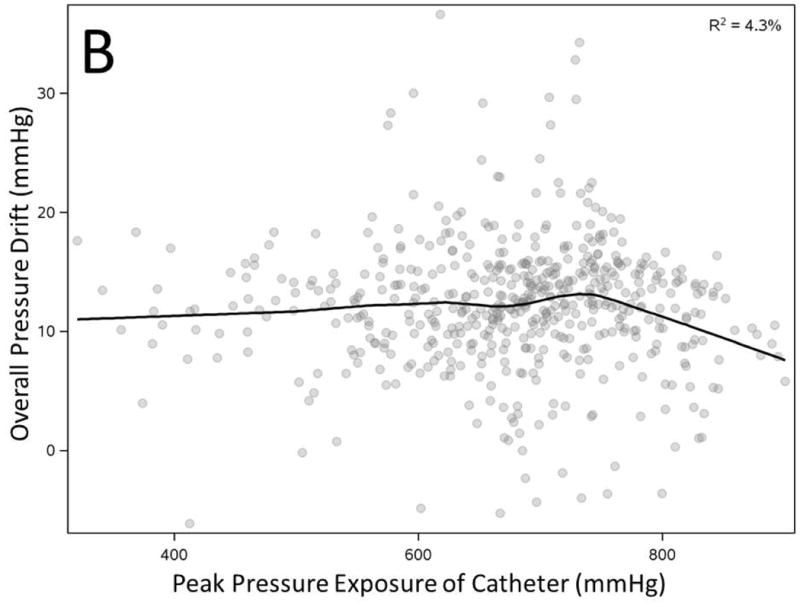
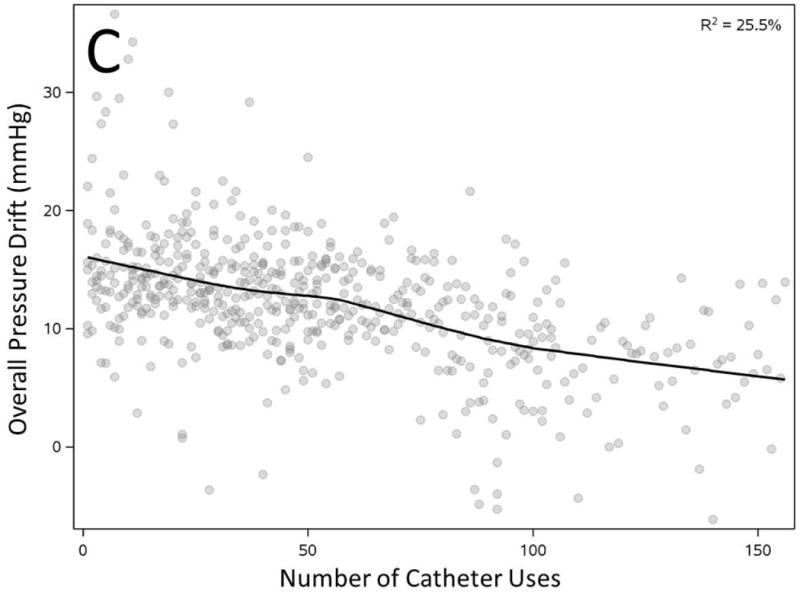
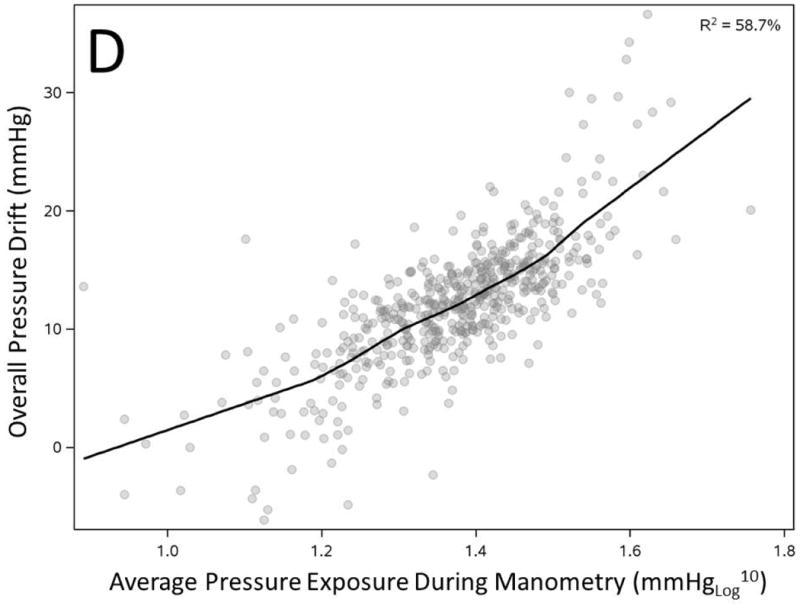
Figure 3. Correlation of overall pressure drift to duration of manometry study (A), peak pressure exposure of catheter (B), number of catheter uses (C) and average pressure exposure of catheter during manometry (D).


All factors showed statistically significant correlation with overall pressure drift (n=536, p<0.0001)
