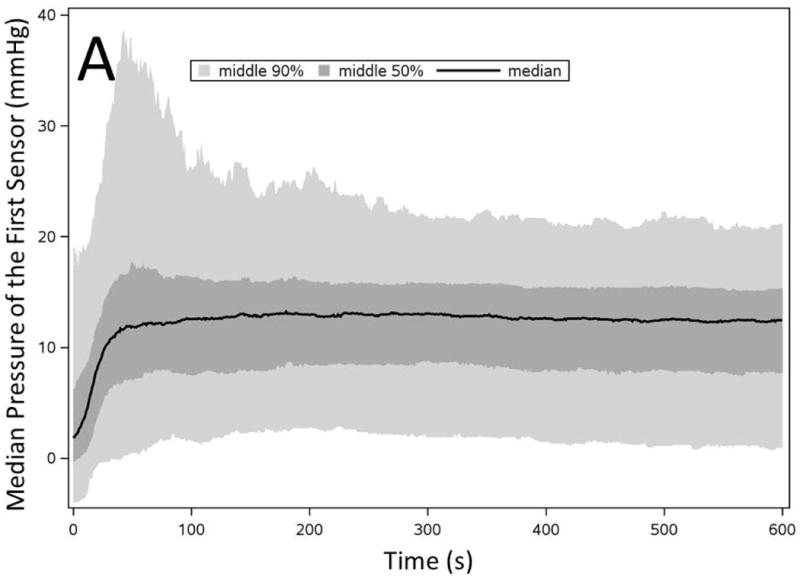
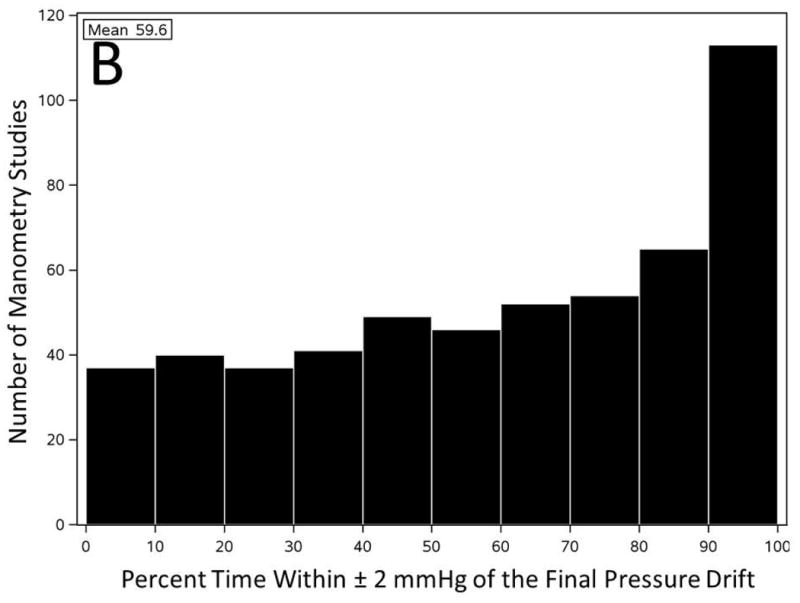
Figure 4. Baseline pressure changes of the first pharyngeal sensor represent development of pressure drift trend throughout a manometry study.


A) Filtered baseline pressure measurement of the first pharyngeal sensor throughout initial 600 seconds of all pressure recordings (n=536). B) Number of manometry studies categorized based on the percentage of time that first pharyngeal baseline pressure remained within ± 2 mmHg of the final PD throughout the entire recording.
