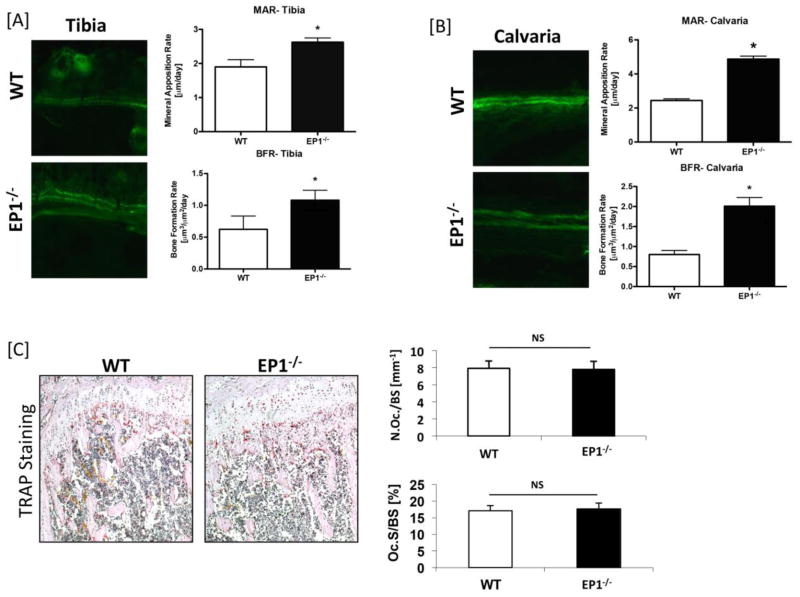
Figure 4. EP1−/− mice show increased bone formation and normal bone resorption.
Calcein labeling was performed on 10 week-old EP1−/− and WT mice. Sections of [A] Tibia and [B] Calvaria were examined by fluorescence microscopy and mineral apposition rates (MAR) and bone formation rates (BFR) were quantified. [C] Femurs from 2 month-old EP1−/− and WT mice underwent TRAP staining to identify TRAP+ osteoclasts; Osteoclast number/bone surface (Oc.N./BS) and osteoclast surface/bone surface (Oc.S./BS) were quantified. Statistical comparisons were performed using Student’s t-test. 5 mice, 3 levels per mouse, were tested in each group, N = 5. (*) = p < 0.05 v.s. WT. Not significant is denoted as “NS”.

