
Fig. 4.
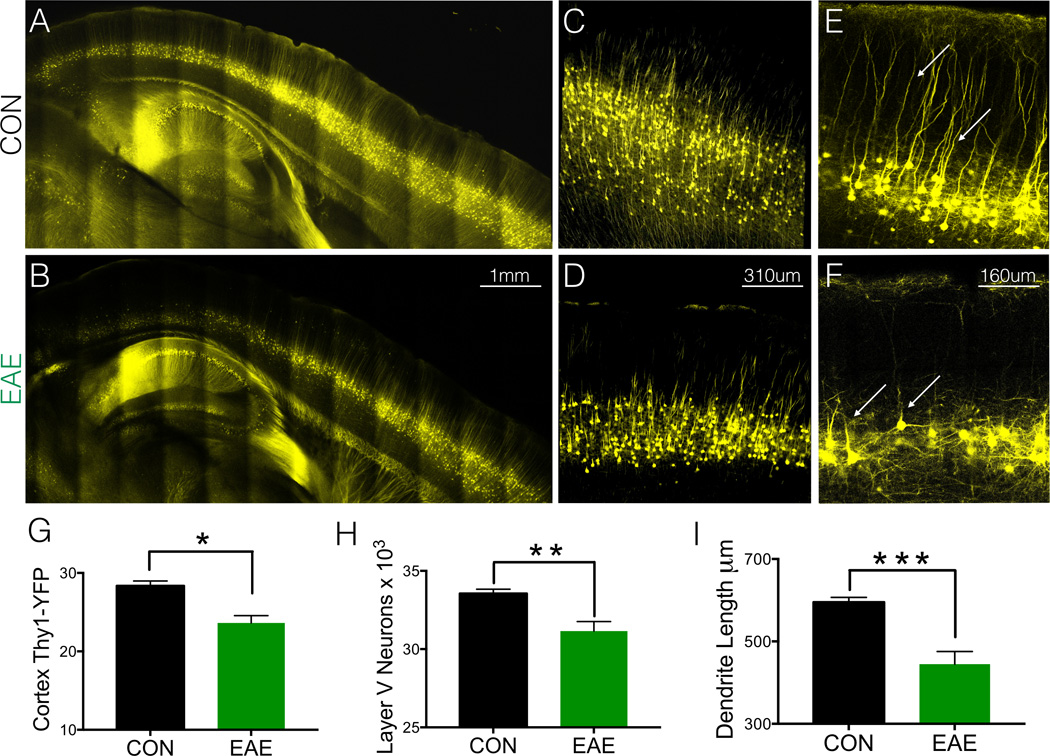
Cortical Pathology. A 3D image stack of Thy1-YFP+ neurons in the cerebral cortex and hippocampus from healthy control (CON) (A) and EAE mice (B). Layer V pyramidal neurons in healthy control (C) and EAE mice (D). Apical dendrites (arrows) from healthy control (E) and EAE mice (F). (G) EAE mice demonstrated a 17% decrease in Thy1-YFP expression in the cerebral cortex compared to healthy control mice. (H) EAE mice demonstrated a loss of 7% of layer V pyramidal neurons compared to healthy control mice. (I) EAE mice demonstrated a decrease in dendrite length of 25% compared to healthy control mice. n = 5. *p = 0.0038, **p = 0.013, ***p = 0.0001. T-test analysis. Error bars indicate SEM.