
Fig. 5.
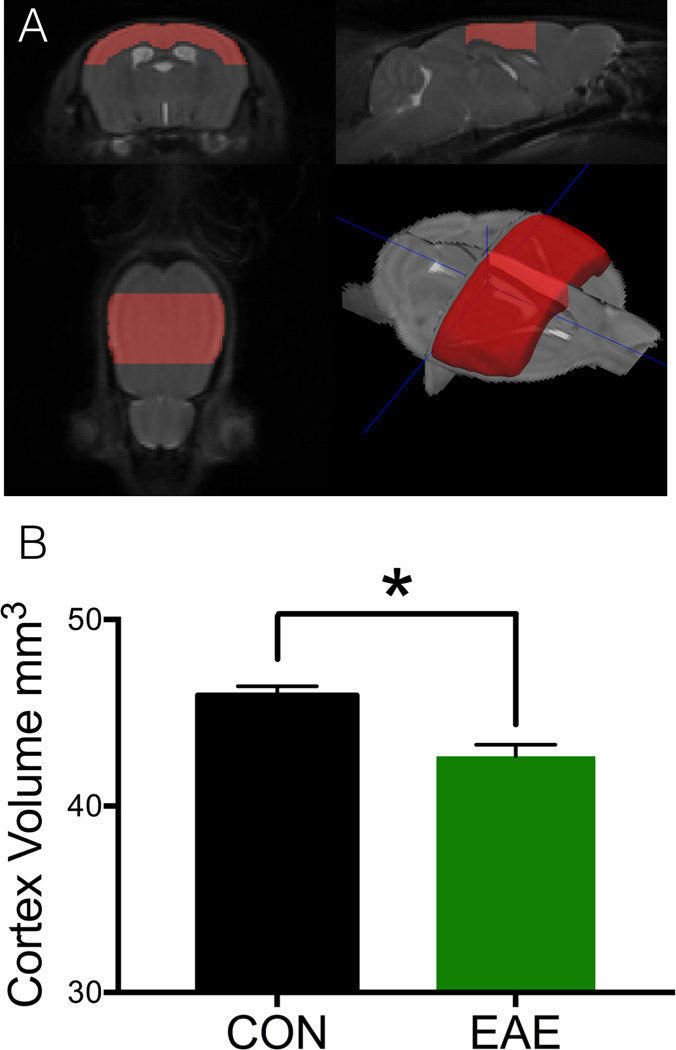
Cortical volume loss in EAE. (A) A minimum deformation atlas comprising the in vivo MRI scans of both healthy control (CON) and EAE mice demonstrating the extent of the cerebral cortex delineation (red). (B) Cortical volume loss of 7% was seen in EAE mice versus healthy controls. n = 5. *p = 0.0032. T-test analysis. Error bars indicate SEM.