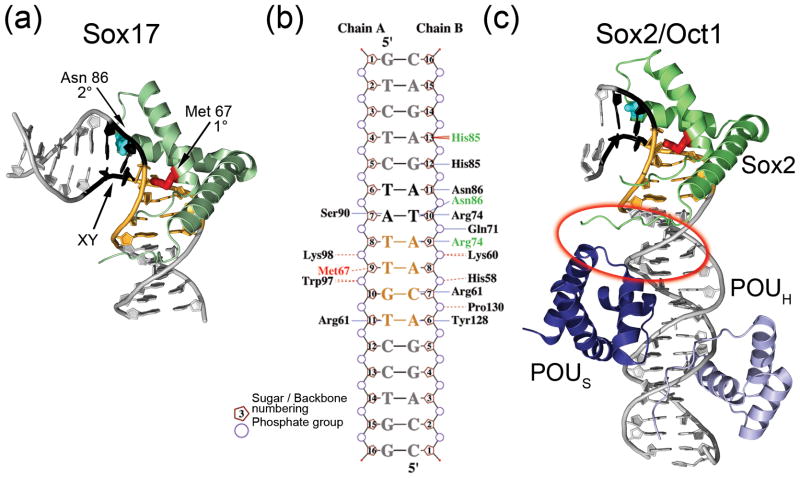
Figure 3. Specificity of DNA recognition.
(a) Sox17-DNA complex. The primary intercalating residue is shown in red, and the residue at the secondary intercalating site is shown in cyan. The bases ‘XY’, for which nucleotide interdependence has been observed, are shown in black, and the primary recognition site sequence is colored orange. (b) Two dimensional representation of the amino acids that contact the DNA in the crystal structures of Sox4 (PDB ID 3U2B) and Sox17 (PDB ID 3F27). The primary intercalating residue is Met 67 (red), and Sox17 amino acids that differ in DNA contacts from the Sox4 structure are indicated in green. Amino acid numbering is based on the Sox4 structure. Hydrogen bonds to the bases are indicated with blue lines and van der Waal’s contacts are shown as broken beige lines. The figure was generated using the program NUCPLOT [82]. (c) Sox2 (green) and the POU domains of Oct1 [51] (PDB ID 1GTO). The protein-protein interaction interface is circled in red. The DNA is colored as in (a).

