
Fig. 2.
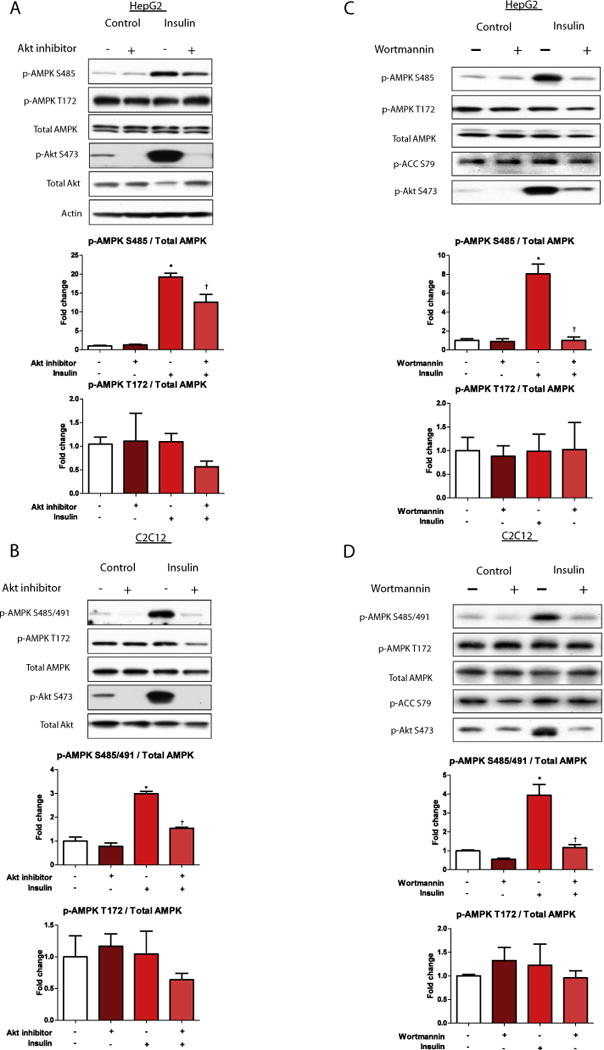
Inhibition of Akt attenuates insulin stimulated phosphorylation of AMPK Ser485/491. HepG2 (A) and C2C12 cells (B) were treated with or without Akt inhibitor VIII (250 μM) for 2 h, then stimulated with insulin (100 nM) for 15 min. Cells were lysed and subjected to western blot analysis. Representative western blots are shown. Quantification of western blots was performed using densitometry, and AMPK phosphorylation was normalized to total AMPK. Results are presented as fold-change in AMPK phosphorylation vs. control in HepG2 cells (A) and C2C12 cells (B). In Figures C (HepG2) and D (C2C12) cells were pre-treated with the PI3-kinase inhibitor wortmannin (10 nM) for 1 h, then stimulated with insulin (100 nM) for 10 min. Cells were processed and protein expression and phosphorylation were quantified as described in (A) and (B). Results are means ± SE (n = 3–6 per treatment). All experiments were performed in triplicate. *p < 0.05 indicates a significant effect of insulin vs. control, †p < 0.05 vs. insulin treatment alone.