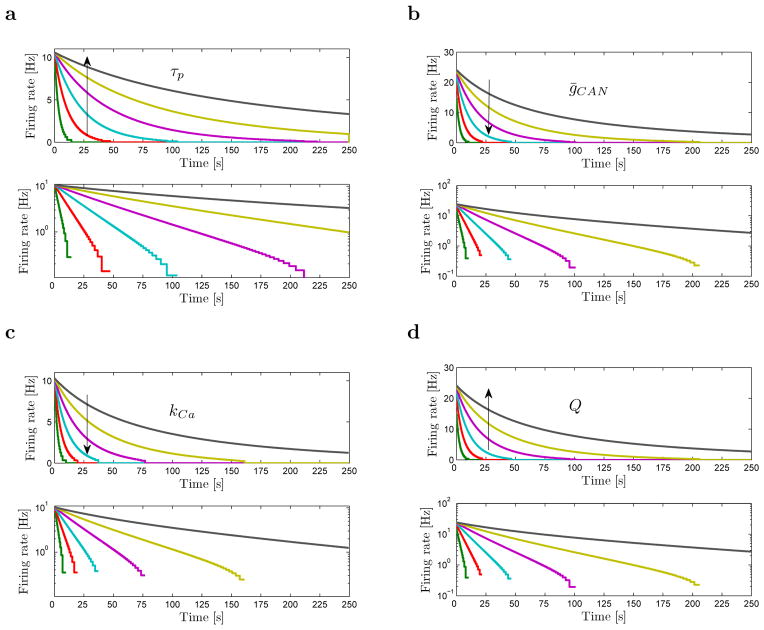
Figure 4.
Simulated firing rate decays exponentially with various time constant for different values of calcium clearance time constant τp, conductivity of the CAN current channels ḡCAN, calcium influx during spikes kCa and the charge required for spike generation Q. Top plot on each of the four figures shows firing rate in linear scale, while bottom plots show firing rate in log scale. Approximately straight lines in the log-plots confirm that the overall decays can be well approximated as exponential. For low firing rates (< 1Hz), the decay deviates from exponential due to increased inaccuracy in the time constant estimation. In each plot, the parameter manipulated is displayed. The arrow shows the ordering corresponding to increasing values of the parameter. a. Influence of τp on the firing rate. Following values of τp were used: [1.4, 1.9, 2.1, 2.2, 2.25, 2.28]s. b. Influence of ḡCAN on the firing rate. The following values of ḡCAN were used: . c. Influence of kCa on the firing rate. Following values of kCa were used: [0.5, 1.4, 1.9, 2.1, 2.2, 2.25, 2.28]/25. Calcium concentration is given as unitless such that initial calcium concentration is normalized to value 1. d. Influence of Q on the firing rate. To change Q we changed specific membrane capacitance cm, so it took the following values: 1/[0.5, 1.4, 1.9, 2.1, 2.2, 2.25, 2.28]μF/cm2.

