
Fig. 5.
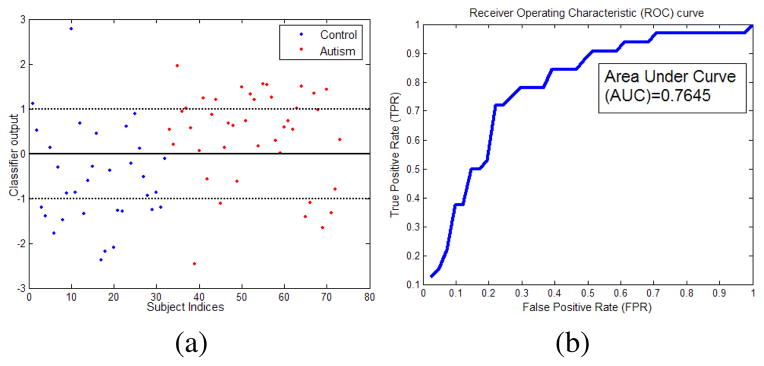
(a) Classifier output (h(x) − b, Eq. (3)) values for the two classes. The thick line is the classification boundary and the dotted lines are the margins. Values above the thick line indicate autism and those below indicate control subjects. Examples inside the margins are harder examples. (b) ROC curve shows that our classifier can perform reasonably well with an area under curve (AUC) of 0.7645. Average specificity and sensitivity is 71.88%. The values are estimated using leave-one-out cross validation.