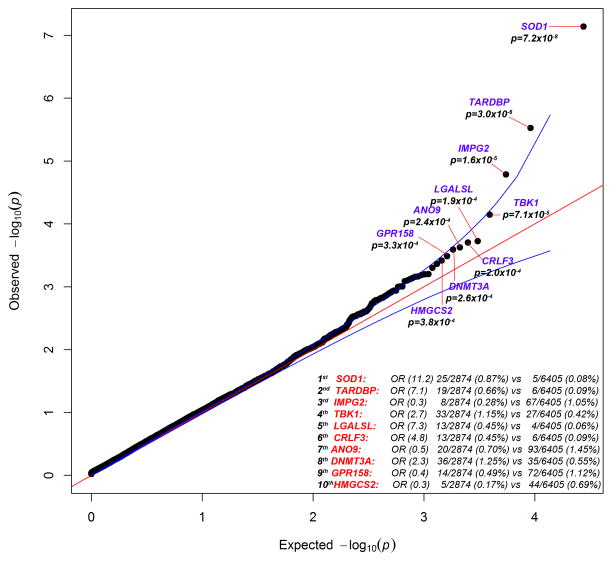
Fig. 1. QQ plot of discovery results for dominant coding model.
The results for the analysis of 2,874 case and 6,405 control exomes are shown. 16,491 covered genes passed QC with more than one case or control carrier for this test. The genes with the top 10 associations are labeled. The genomic inflation factor, lambda (λ), is 1.061. The association with SOD1 passed correction for multiple tests.

