
Fig 3. Comparative analysis of the effect of MEM, NMDA and two NMDAR antagonists (DM and Kyn) on bacterial intracellular survival.
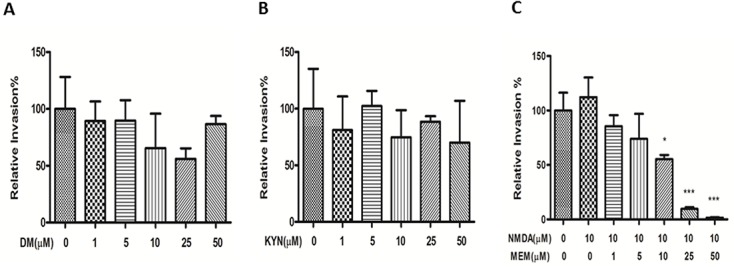
HBMECs were incubated with various concentrations of DM (A) and Kyn (B) 24 h before adding bacteria. (C) Effect of NMDA (10 μM) on bacterial intracellular survivals of HBMEC. All values are presented as relative invasion %. All invasion assays were performed in triplicate wells. Bar graphs show the means ± SD of triplicate samples. Significant differences between the treatment and the control groups are marked by asterisks (*P<0.05; ***P<0.001).