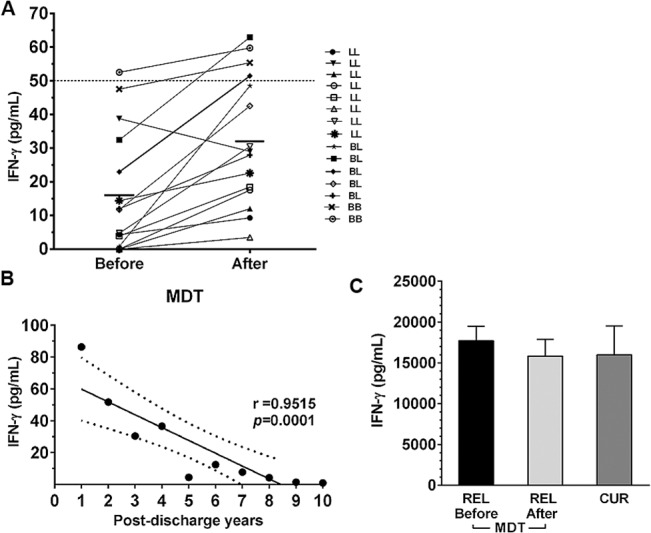
Fig 1. IFN-γ production in response to M. leprae in MB relapsed patients and cured individuals.

IFN-γ levels after 5-day ex vivo PBMC stimulation with whole M. leprae (ML, 20 μg/mL) in relapsed multibacillary patients before and after MDT treatment. Horizontal lines show the median of the group (n=15). A). Correlation between levels of IFN-γ production and post-discharge years in clinically cured individuals under post-MDT follow-up. Each symbol represents one single individual. The numbers below the x-axis represent the number of years since cure. r = correlation coefficient; p = significance level (Pearson test, correlation analysis). B). IFN-γ production in response to 5 μg/mL PHA. The columns represent the median (range) of each tested relapsed group (REL and CUR, cured patients). C). ELISA; values ≥ 50 pg/mL are considered positive (Kruskal-Wallis test, comparison of stimulated cells with unstimulated cells; Mann–Whitney test, group comparisons).
