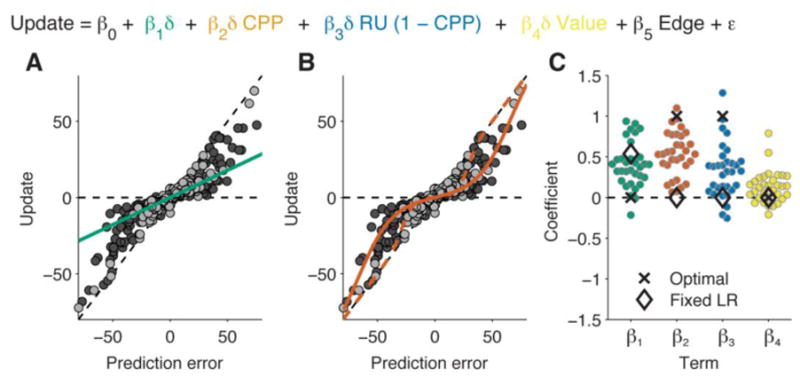
Figure 2.

Behavioral results. A: Example data from one participant, illustrating the fit obtained using only a fixed-learning-rate term. Each data point represents a trial. A fixed learning rate implies a linear relationship between prediction error (current outcome minus previous prediction) and update (next prediction minus previous prediction), regardless of noise (light gray = low noise; dark gray = high noise). B: Illustration of the fit obtained with a change-point probability term, using the same data as in panel A. Here the learning rate is adaptive (non-linear) and depends on noise. C: Coefficients from the full regression-based analysis of behavioral data (see inset equation), with coefficients estimated for each participant individually. The four plotted coefficients correspond to a fixed learning rate (β1, panel A), change-point probability (β2, panel B), relative uncertainty (β3), and reward value (β4). Estimates of β4 are scaled by a factor of 5 for visibility. Black markers show the results of fitting the regression model to simulated data generated by the approximate Bayesian model (“Optimal”) or by a model with a fixed learning rate (“Fixed LR”).
