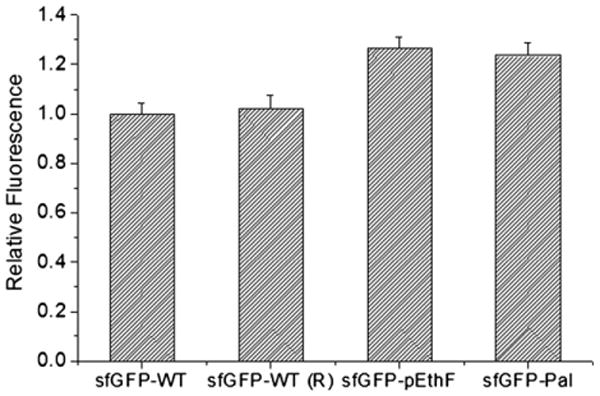
Fig. 3.

The relative fluorescence of the sfGFP-WT and sfGFP variants. Protein solutions (20 μg/mL) were loaded onto a 96-well microplate at 100 μL per well, and read on the plate reader at λex = 480 nm and λem = 510 nm. Values were averaged for each protein (n = 5), and normalized to the fluorescence of the sfGFP-WT. In order to investigate the effect of reagents used in CuAAC, the sfGFP-WT was treated in parallel with the sfGFP-pEthF subjected to the fatty acid-conjugation, and designated sfGFP-WT (R).
