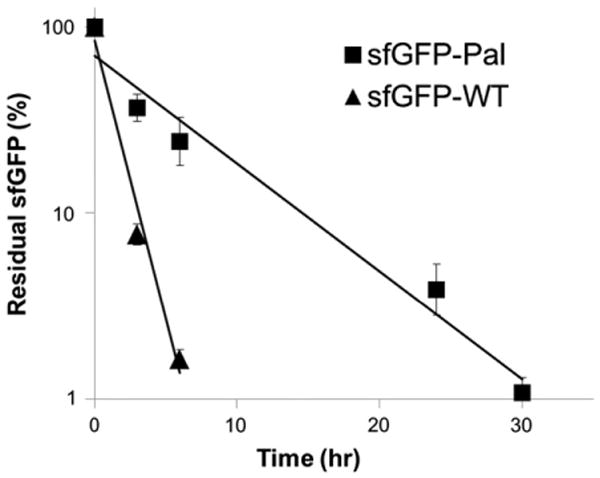
Fig. 5.

Pharmacokinetics of the sfGFP-WT and the sfGFP-Pal. Four mice were intravenously administered the sfGFP-Pal (square) or the sfGFP-WT (triangle), respectively, and serum concentrations were measured by ELISA at different time points (mean ± s.d.): 0 (10 min), 3, and 6 h for the sfGFP-WT; 0 (10 min), 3, 6, 24, and 30 h for the sfGFP-Pal. Data were normalized with regard to the initial value, plotted in a logarithmic scale versus time post-injection, and fitted into a straight line (R2 = 0.98 for the sfGFP-WT and 0.97 for the sfGFP-Pal).
