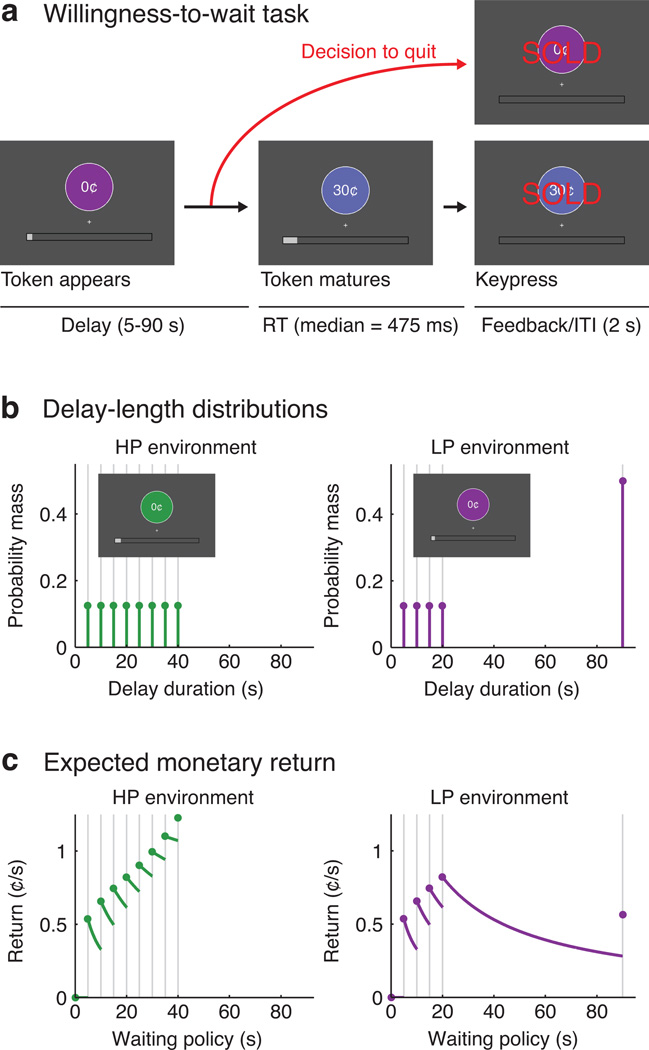
Figure 1.
Experimental task and timing conditions. A: Schematic of the willingness-to-wait task. B: Discrete probability distributions governing the scheduled delay times in each environment. C: Expected monetary rates of return under various waiting policies, where each policy is defined by a giving-up time. The reward-maximizing policy was to wait up to 40s in the HP environment (i.e., never to quit), but only up to 20s in the LP environment. These rates of return are contingent on the fixed 2s inter-trial interval (ITI).

