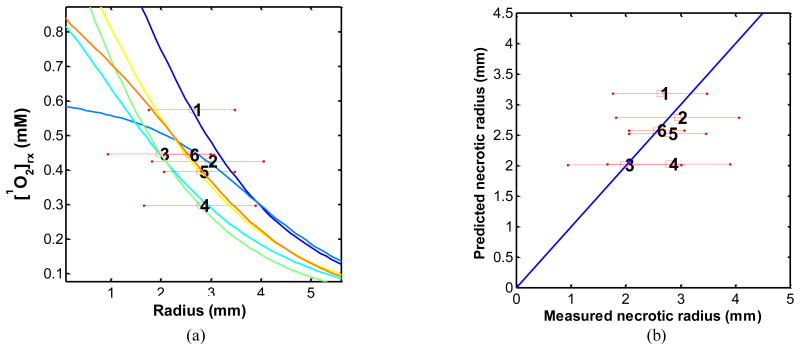
Figure 4.
(a) [1O2]rx profiles for 18 mice using the model parameters (ξ, σ, β, g) in Table 1 for BPD. The corresponding source strength, total energy released per unit length, and initial photosensitizer concentration for each group of 3 mice are shown in Table 3. The symbol with error bar indicates the PDT-induced necrotic radius with standard deviation for each mouse. (b) PDT-induced necrotic 4.radius predicted vs. measured for mice shown in figure (a).

