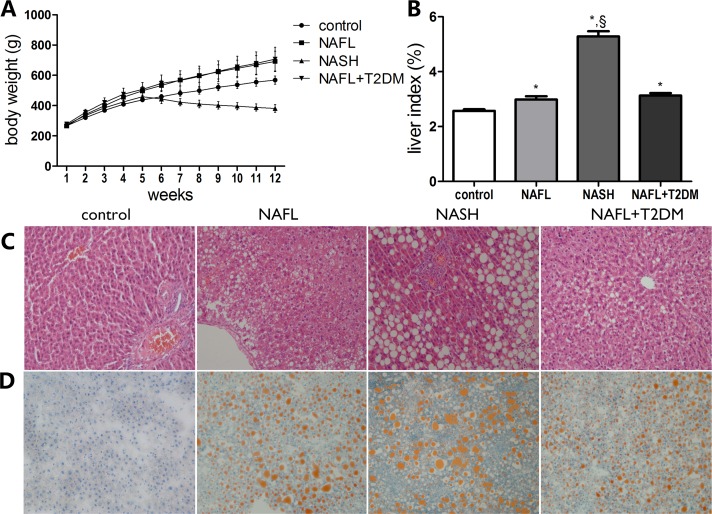
Fig 2. The establishment of rat models in NAFL, NASH and NAFL + T2DM.
(A) Changes in body weight of rats during standard diet (control), high fat diet (NAFL and NAFL + T2DM) and methionine-choline-deficient diet (NASH) feeding. (B) Liver index (the ratio of liver weight to body weight) of the rats at the end of the experiment. Liver histological examination with H&E (x 200) (C) and Oil-Red-O staining (x 200) (D). Data are expressed as the mean ± SD (n = 10 per group). *P < 0.05 compared with the control group; §P < 0.05 compared with the NAFL group.

