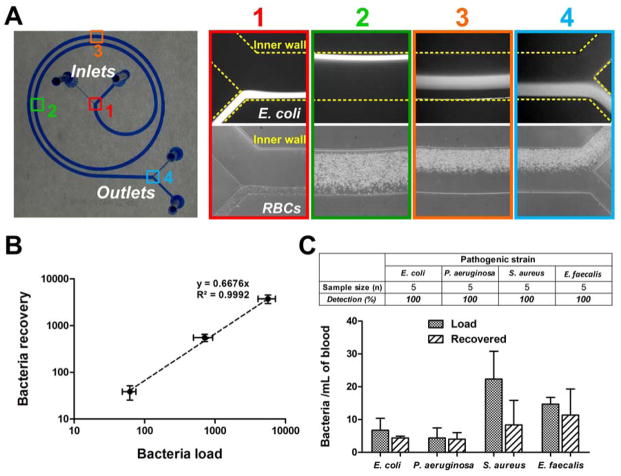
Figure 2.
Device characterization using bacteria and whole blood at Dean Cycle 1 (DC 1). (A) Optical image of the PDMS-fabricated spiral device (microchannel was filled with blue dye for visualization). Equilibrium positions of FITC-conjugated E. coli bioparticles (averaged composite images) and RBCs (high speed images) illustrate their differences in Dean migration and inertial focusing along the channel. Corresponding positions of the captured images are shown on the device. (B) Recovery plot (log scale) indicating high bacterial recovery (>65%) over a range of bacterial loads (E. coli) spiked into 1 mL of whole blood. (C) Histogram plot indicates the bacterial load and recovery for different pathogenic strains at clinically relevant concentrations (~10–50 cells/mL). Bacteria were successfully detected as colony forming units (cfu) from the bacterial outlet in all cases.

