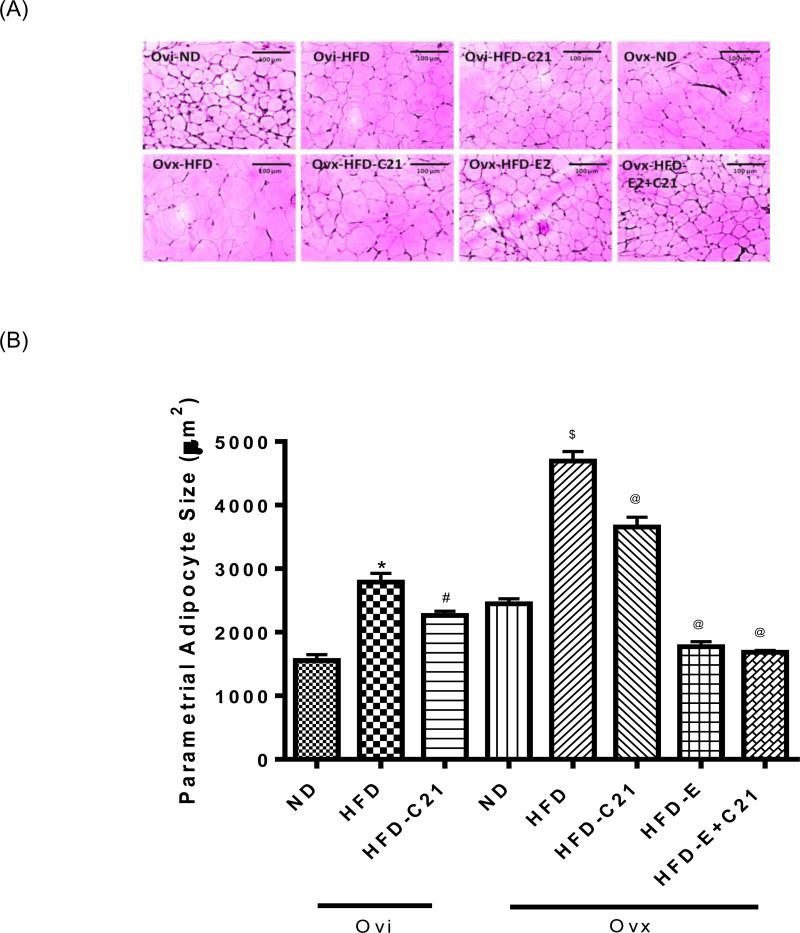
Fig. 2. The parametrial adipose tissue (pWAT) adipocyte size in different treatment groups of ovary-intact (Ovi) and ovariectomized (Ovx) mice fed with ND or HFD (2-week protocol).
(A) Representative micrograph of pWAT adipocyte (magnification, 10X). (B) Bar graphs represent the adipocyte size expressed as cell area (μM2). Results are means ± SEM; * -significantly different from Ovi on ND, # - significantly different from Ovi on HFD, $ - significantly different from Ovx on ND, @ - significantly different from Ovx on HFD. Data were analyzed using one-way ANOVA with Newman-keuls post hoc test and Student's t test (p<0.05); N=3 (3 sections per slide from 3 mice). (ND - Normal Diet, HFD - High-Fat Diet, HFD-C21 - High-Fat Diet on C21, HFD-E - High-Fat Diet on E2, HFD-E+C21 - High-Fat Diet on E2+C21).

