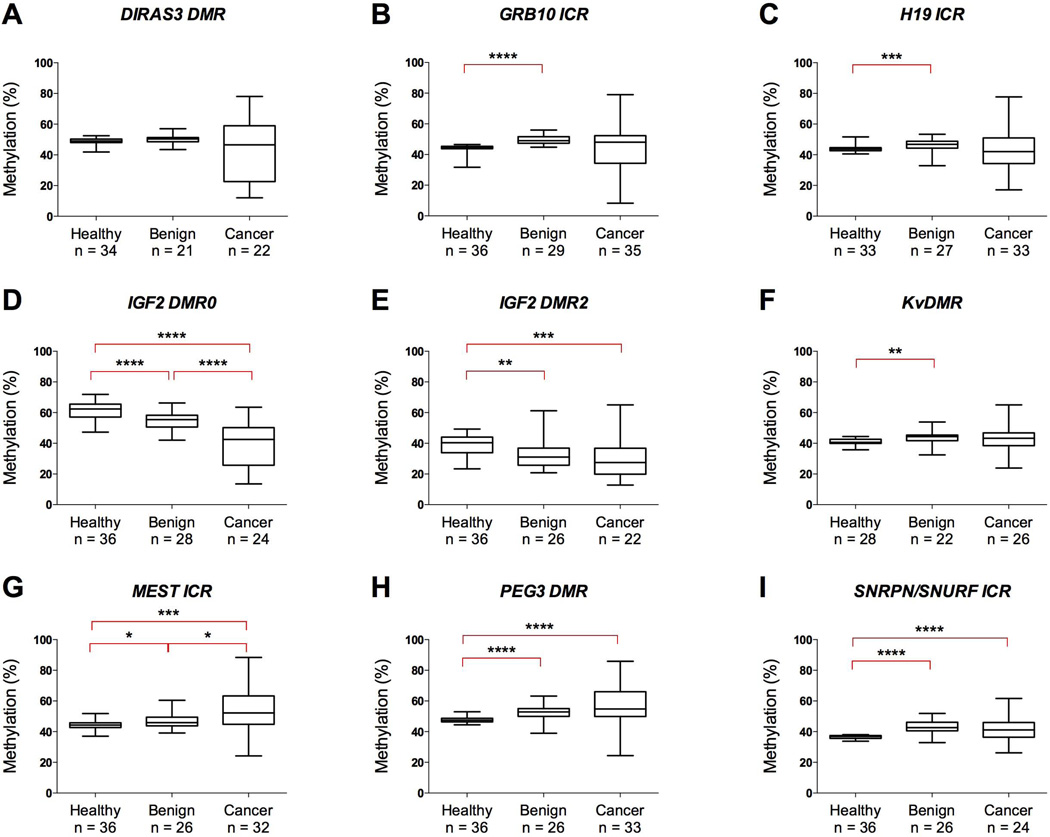
Figure 1. DNA Methylation at nine imprinted regions in breast tissue from patients and healthy individuals.
Measured methylation values in breast tissue for DIRAS3 DMR (A), GRB10 ICR (B), H19 ICR (C), IGF2 DMR0 (D), IGF2 DMR2 (E), KvDMR (F), MEST ICR (G), PEG3 DMR (H) and SNRPN/SNURF ICR (I) in healthy individuals and patients with benign breast disease and invasive cancer. Boxes correspond to the median and interquartile range, and the whiskers to the full range of measured values. Statistically significant differences are indicated (Mann-Whitney U Test; * = p < 0.05; ** = p <0.01; *** = p < 0.0005; **** = p < 0.0001).

