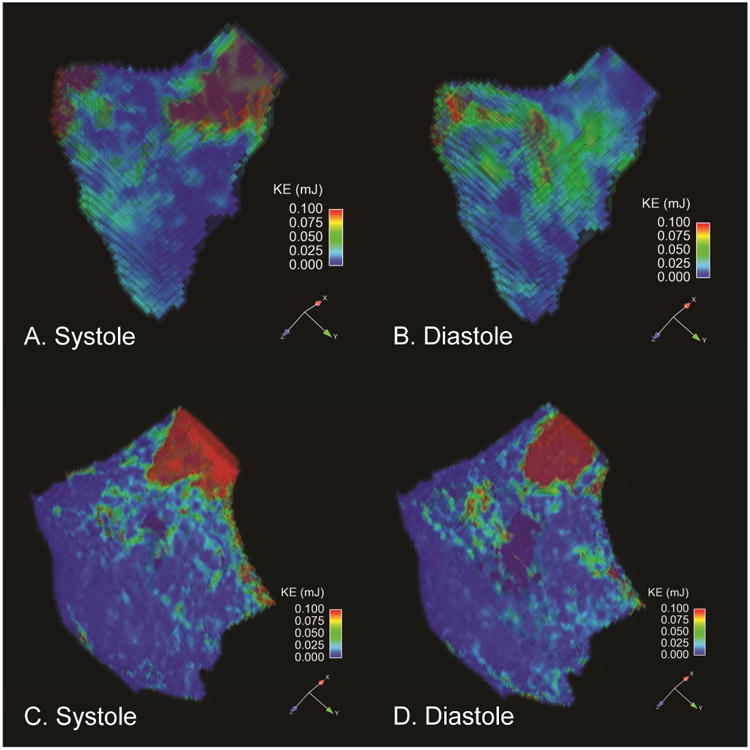
Figure 1.

[A-B]. Healthy Volunteer RV Kinetic energy maps in a long axis orientation. The figures demonstrate the KE values of each voxel of blood in the segmented plane where the highest KE values are marked in red. Note that highest kinetic energies are seen along the RV outflow tract during systole and along the RV inner curvature during diastole. [C-D]. rTOF RV Kinetic energy maps oriented along the RV outflow tract. Note that highest kinetic energies are seen along the RV outflow tract during systole and diastole due to the presence of pulmonic regurgitation in this patient.
