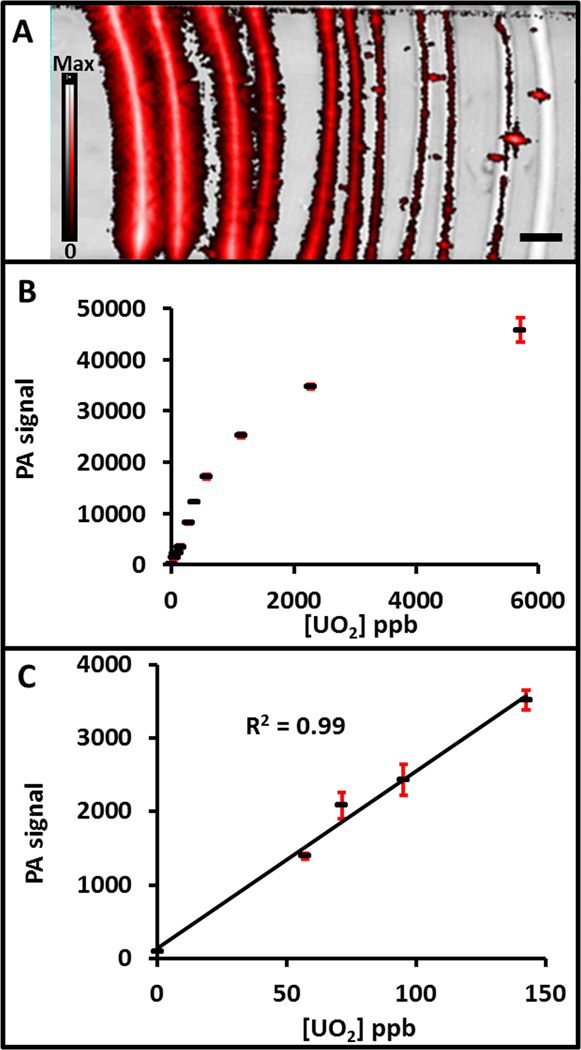
Figure 3. Photoacoustic detection limits for the complex-NPs.
A) Decreasing concentrations of the complex-NPs were placed inside plastic tubing and sealed within an agar phantom from left to right. Both B-mode (black and white) and photoacoustic mode (red) imaging was performed. B) Quantitation of the imaging data revealed a U dose dependence and a plateau above 1 ppm uranium. This regime is the equivalent of 5.2 µM – 0.052 µM uranium chelate. C) Plot of the lower region of the graph in B, showing the linear behavior (R2 > 0.99) at and below 150 ppb uranium. The calculated limit of detection is 6.2 ppb. In both panels B and C, the red error bars represent the standard deviation. The scale bar in A represents 5 mm.

