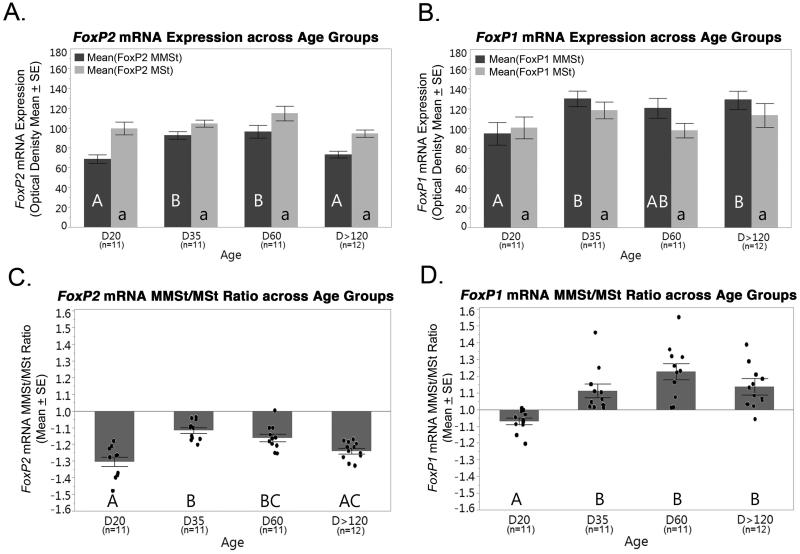
Figure 3.
(A) FoxP2 mRNA expression in the MMSt (dark grey) and MSt (light grey) across age groups. No significant differences were found between groups in the MSt (p<0.05). (B) FoxP1 mRNA expression in the MMSt and MSt across age groups. No significant differences were found between age groups for both the MSt. FoxP1 mRNA expression in the MMSt was significantly lower at D20 compared to D35 and D>120. (C, D) FoxP2 and FoxP1 mRNA expression ratios (MMSt/MSt) show significant differences between age groups (p<0.05). Points in (C) and (D) represent individual birds. For all graphs, significant mRNA expression differences in the MMSt, MSt, (A, B, respectively) or a ratio thereof (C, D), between the four age groups is denoted with different letters. Bars with different letters are significantly different (p<05). The letter case is used to denote significant differences between age groups separately for the MMSt (uppercase) and MSt (lowercase). Error bars = SE.

