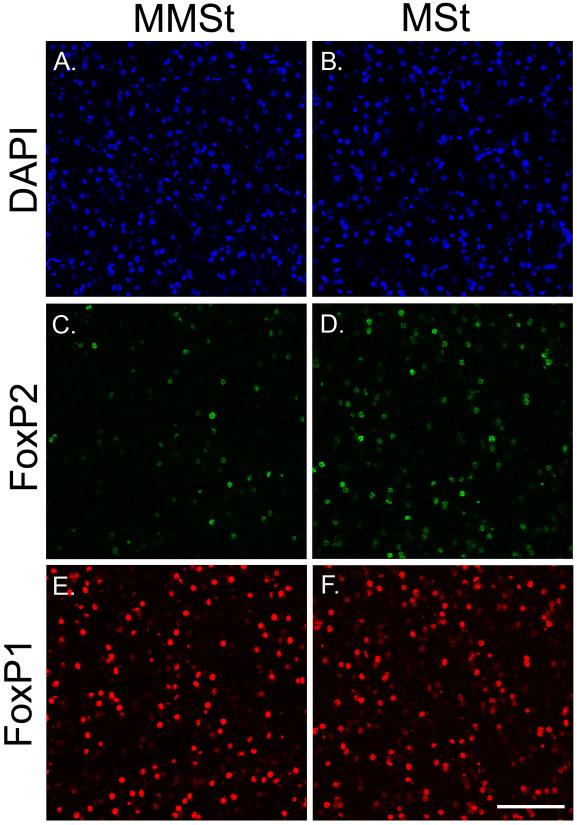
Figure 4.
Confocal images taken with a 40X objective to detect FoxP2 and FoxP1 protein within the MSt and MMSt. Example images are shown from a female animal at D35. From top to bottom: (A, B) DAPI stained cells in 405 nm within the MMSt and MSt; (C, D) FoxP2 protein expressing neurons in 488 nm within the MMSt and MSt; (E, F) FoxP1 expressing neurons in 594 nm within the MMSt and MSt; Scale bar in H = 50 μM.

