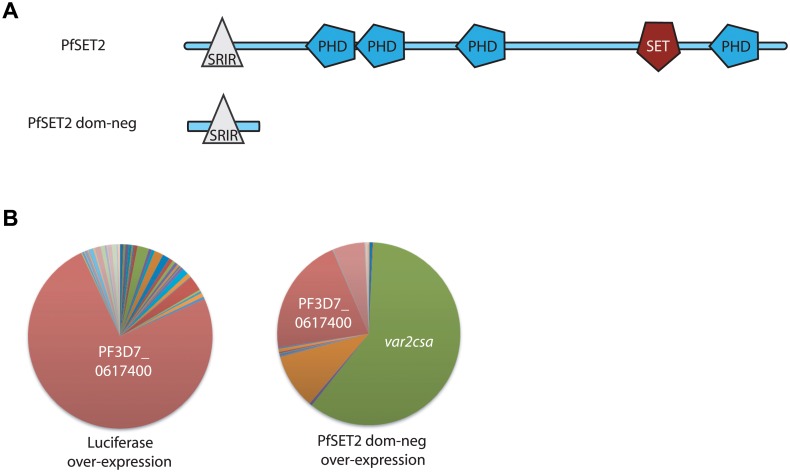
Fig 1. Effect of over-expression of PfSET2 dom-neg on var gene expression.
(A) Schematic diagram of the domain structure of PfSET2. The top image shows the conserved domains identified using SMART (Simple Modular Architecture Research Tool, http://smart.embl-heidelberg.de). PHD domains are shown as blue polygons while the methyltransferase domain (labeled SET) is shown in red. The SET2 Rpb1 Interacting Region (SRIR) is shown as a white triangle. (B) var gene expression is shown as a pie-chart, with each slice of the pie representing the fraction of the total var mRNA pool transcribed from each var gene. The left chart shows the var gene expression pattern in a population over-expressing firefly luciferase. This is unchanged from the untransfected population and the annotation number of the dominant gene is shown in white text. The chart on the right shows the var gene expression pattern in a population after over-expression of the PfSET2 dominant negative construct for 6 weeks. var2csa (PF3D7_1200600, shown in green) has become the dominant transcript. Individual copy number values for each transcript are shown in S1 Fig.

