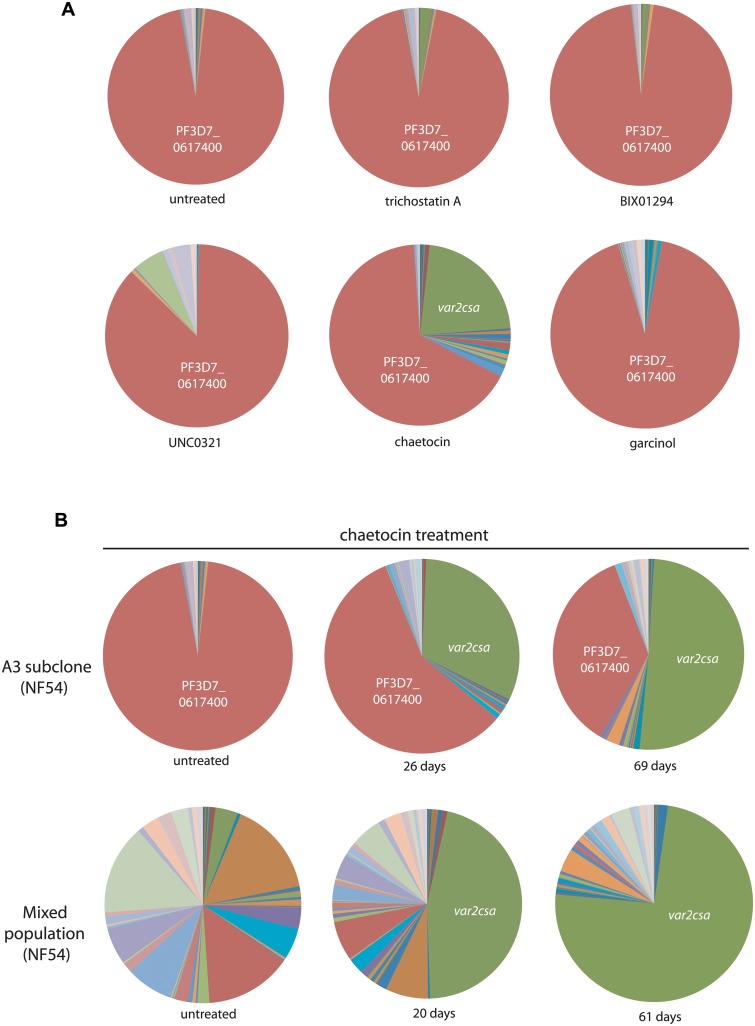
Fig 4. Induction of var2csa expression by treatment with a histone methyltransferase inhibitor.
(A) The A3 subclone of the NF54 line of P. falciparum was treated for 2 weeks with sub-IC50 concentrations of various compounds known to inhibit histone modifiers in high eukaryotes. After 2 weeks of exposure, the var gene expression pattern was determined for each population and shown as a pie chart. In all cases the var gene that was originally dominant in this population (PF3D7_0617400, shown in red) remained dominant, however the population exposed to chaetocin displayed a significant proportion that had switched to var2csa (green). (B) Two subclones of NF54 (A3 and a mixed population) were cultured in the presence of chaetocin and their var gene expression patterns determined after varying lengths of time. In both cases, var2csa became the dominant var transcript detectable in the population. Individual copy number values for each transcript are shown in S6 Fig.

