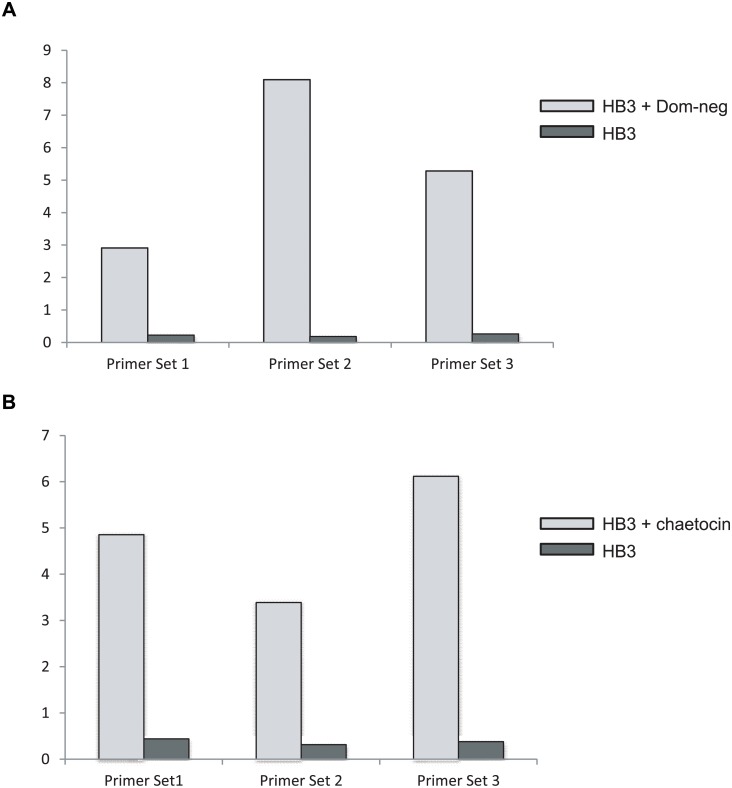
Fig 5. Induction of var2csa in the parasite line HB3.
The expression level of var2csa in HB3 was determined by Q-RT-PCR and displayed as relative copy number as compared to seryl-tRNA synthetase. Three separate PCR primer pairs (shown in Table 2) were used that anneal at different points within the var2csa coding region. (A) mRNA expression levels of var2csa are shown before and after 3 weeks of exposure to over-expression of the PfSET2 dom-neg expression construct. B. mRNA expression levels of var2csa are shown before and after 3 weeks of exposure to chaetocin.

