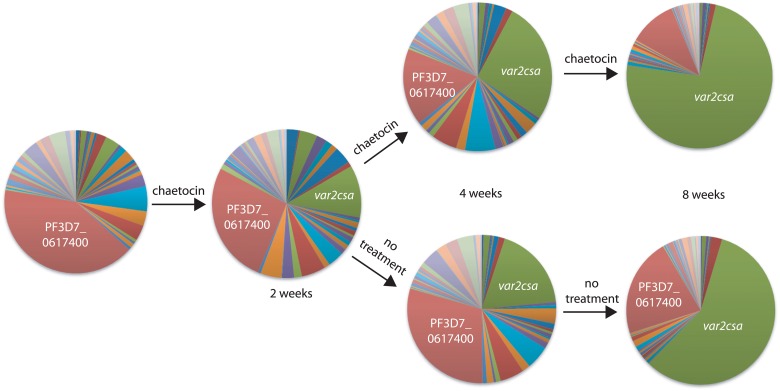
Fig 8. Short-term exposure to chaetocin leads to long-term induction of var2csa expression.
Q-RT-PCR was used to determine var gene expression patterns and displayed as pie charts. Prior to exposure to chaetocin, the gene PF3D7_0617400 (red) was most highly expressed within this population of parasites (left most pie chart). These parasites were exposed for two weeks to chaetocin then divided into two subcultures, one which was maintained in the presence of chaetocin (top) while the other was grown in the absence of chaetocin (bottom). After 8 weeks of growth, var2csa (green) had become the dominant var transcript in both populations. Individual copy number values for each transcript are shown in S12–S14 Figs.

