
Fig. 6.
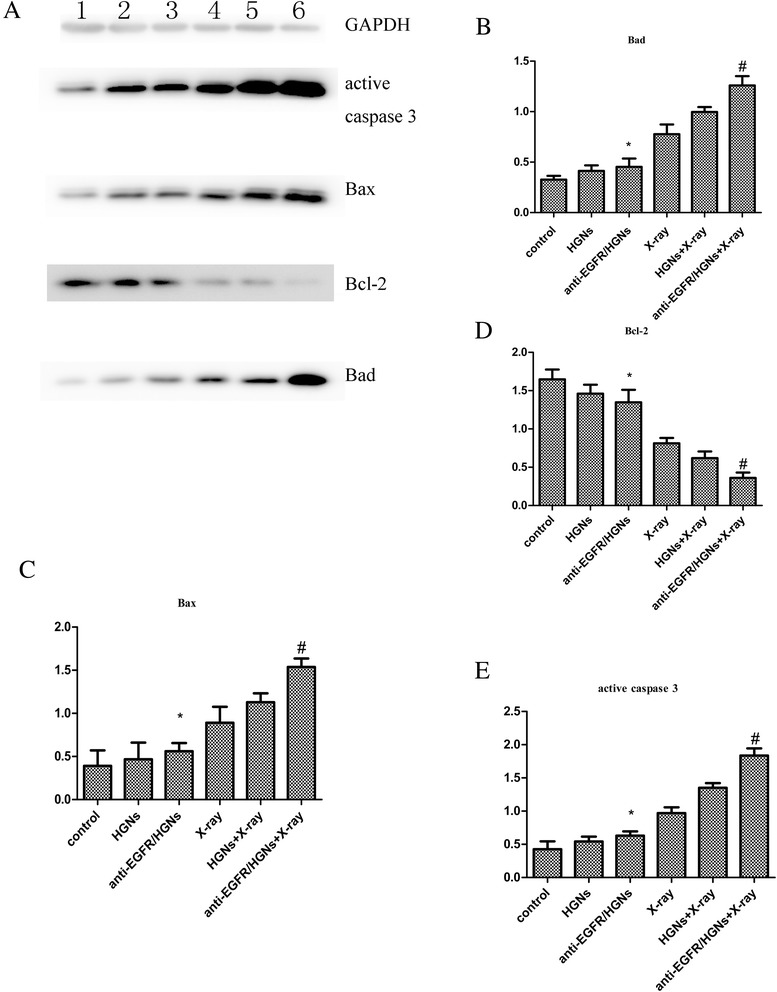
Western blot of protein expression of Bcl-2, Bax, Bad, and active caspase 3. a Lane 1 indicates control, lane 2 naked HGNs, lane 3 anti-EGFR/HGNs, lane 4 X-ray alone, lane 5 naked HGNs + X-ray, and lane 6 anti-EGFR/HGNs + X-ray. The diagrams show the ratio of intensities of the Bad (b), Bax (c), Bcl-2 (d), and active caspase 3 (e) bands to the GAPDH band. *P > 0.05 (anti-EGFR/HGNs vs control); # P < 0.05 (anti-EGFR/HGNs + X-ray vs X-ray)